ReliabilityFirst
Winter Reliability Assessment
2025-26

By Tim Fryfogle, Principal Engineer – Resources, Engineering & System Performance
ReliabilityFirst conducts annual seasonal reliability assessments to evaluate resource adequacy across its region. These assessments rely on data from the PJM Interconnection (PJM) and the Midcontinent Independent System Operator (MISO) to identify potential risks and ensure system reliability. The Winter Reliability Assessment, published each December, provides insights at the start of the cold-weather season when demand and operational challenges typically increase.
The upcoming winter season projects to bring with it a low risk to electric reliability in both the PJM and MISO footprints under the expected electric demand forecast, according to ReliabilityFirst analysis.
Using data provided by both PJM and MISO, we conduct our annual winter reliability assessment using two forecast scenarios:
- The 50/50 demand forecast, which projects a 50% likelihood that electricity demand exceeds projected load. This scenario is considered more likely to occur.
- The 90/10 demand forecast, which projects a 10% likelihood that electricity demand exceeds extreme load. This scenario is considered more extreme.
These scenarios are used to evaluate whether available resources can meet demand under both typical and stressed system conditions. The analysis also considers factors such as generator outages to determine overall reliability risk for the upcoming winter season (December, January, and February).
PJM


PJM Interconnection map (Source: FERC)
PJM Interconnection map (Source: FERC)
PJM’s planning reserve margin requirement for 50/50 load is 17.7% for the 2025 planning year and its forecasted reserve margin is above that figure at 35.6%, suggesting that resources are projected to meet expected demand.
Exhibit 1 shows PJM’s winter outage likelihood based on different generation outage levels, with the two yellow dots showing winter outage probability in the 50/50 demand forecast and the 90/10 demand forecast, respectively. The vertical axis indicates the percent probability and the horizontal axis shows the outage total in megawatts.


Exhibit 1: PJM 2025/2026 Winter Outage Probability
Exhibit 1: PJM 2025/2026 Winter Outage Probability
50/50 Demand Forecast
PJM’s 50/50 demand forecast projects its footprint to have adequate resources to serve normal electric demand in the upcoming winter season, including during expected periods in which certain generation resources become unavailable. Our analysis projects a less than 1% chance of PJM experiencing 39,500 MW of generation unavailability and being unable to serve the forecasted load.
90/10 Demand Forecast
Should the system encounter a scenario in which there is a combination of higher demand and/or generation outages above anticipated levels during the upcoming winter season, PJM projects to still have less than 1% chance of being unable to serve load in that scenario. This is shown in Exhibit 1 by the yellow dot on the left marking the 90/10 demand forecast.
Taking both of these forecast scenarios together, the PJM footprint is considered to have low reliability risk for the upcoming winter. This is a change from last year’s winter assessment, in which PJM was considered to have greater reliability risk associated with potential constraints on the use of the Transco Regional Energy Access (REA) gas pipeline due to ongoing litigation contesting its use. RF analysis indicated that under extreme outages and demand in PJM, if the Transco REA gas pipeline were not in service there was a risk of load not being served. In early 2025, FERC reinstated the certificate for this project, allowing it to fully come online and therefore alleviating this reliability risk.
MISO

Midcontinent Independent System Operator (MISO) map (Source: FERC)
Midcontinent Independent System Operator (MISO) map (Source: FERC)
MISO’s planning reserve margin requirement for 50/50 load is 38.6% for the 2025 planning year and its forecasted reserve margin is above that figure at 49.5%. This indicates that resources are projected to meet expected demand.
Exhibit 2 shows MISO’s winter outage likelihood based on different generation outage levels, with the two yellow dots showing winter outage probability in the 50/50 demand forecast and the 90/10 demand forecast, respectively.

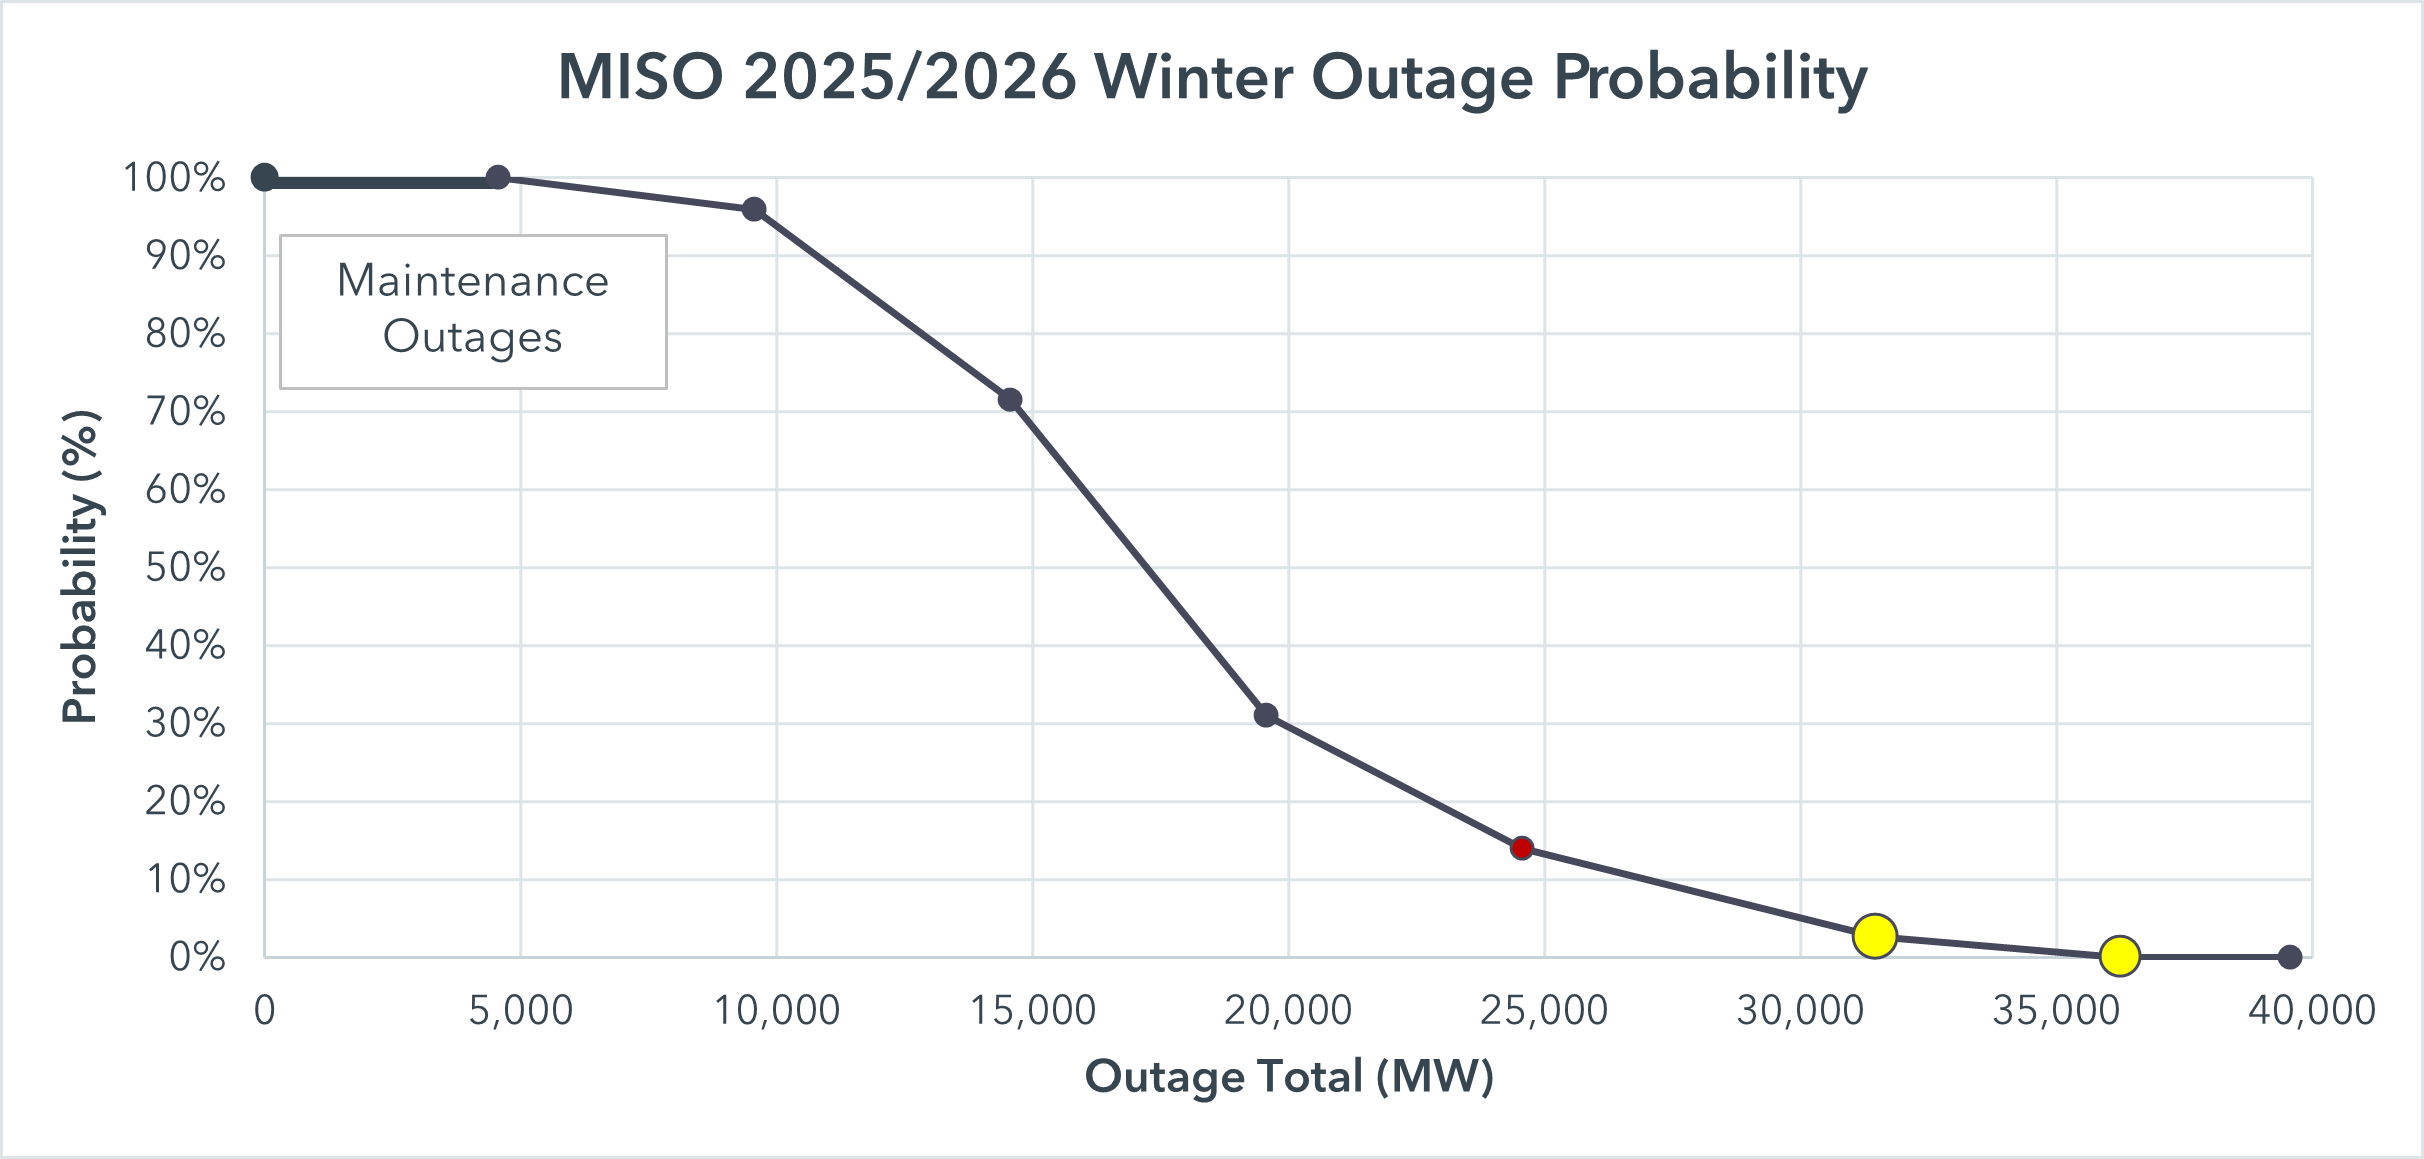
Exhibit 2: MISO 2025/2026 Winter Outage Probability
Exhibit 2: MISO 2025/2026 Winter Outage Probability
50/50 Demand Forecast
MISO’s 50/50 demand forecast projects adequate resources to serve normal electric demand in the upcoming winter season, including during expected periods in which certain generation resources become unavailable. Our analysis projects a less than 1% chance of MISO experiencing 36,300 MW of generation unavailability and being unable to serve forecasted load, as shown by the yellow dot on the right.
90/10 Demand Forecast
The risk of MISO not having enough resources to meet expected demand under the more extreme 90/10 demand forecast is also low at approximately 3% probability, according to our analysis. This is shown by the yellow dot on the left.
Taking both of these forecast scenarios together, the MISO footprint is also considered to have low reliability risk for the upcoming winter. This also represents an improved winter outlook for the MISO footprint. In the 2024-25 winter season, MISO experienced a significant retirement in coal resources in addition to a high reserve margin target. However, for the 2025-26 season, MISO was able to procure more resources for winter by implementing a seasonal resource adequacy construct and seasonal unit accreditation to better affirm adequate supply in all seasons.
Additional considerations
For both PJM and MISO, should the system encounter a scenario in which there is a combination of higher demand and generation outages that exceed the levels identified in this assessment, the risk profile would increase. Under these circumstances, each entity has mechanisms like Load Modifying Resources (i.e., demand response), non-firm energy transfers into the system, and energy-only resources to assist in mitigating this risk.