ReliabilityFirst
Resource Adequacy Report
2026

Executive Summary
This Resource Adequacy Report assesses whether the ReliabilityFirst region will have sufficient electricity resources to reliably meet rapidly increasing demand over the next decade.


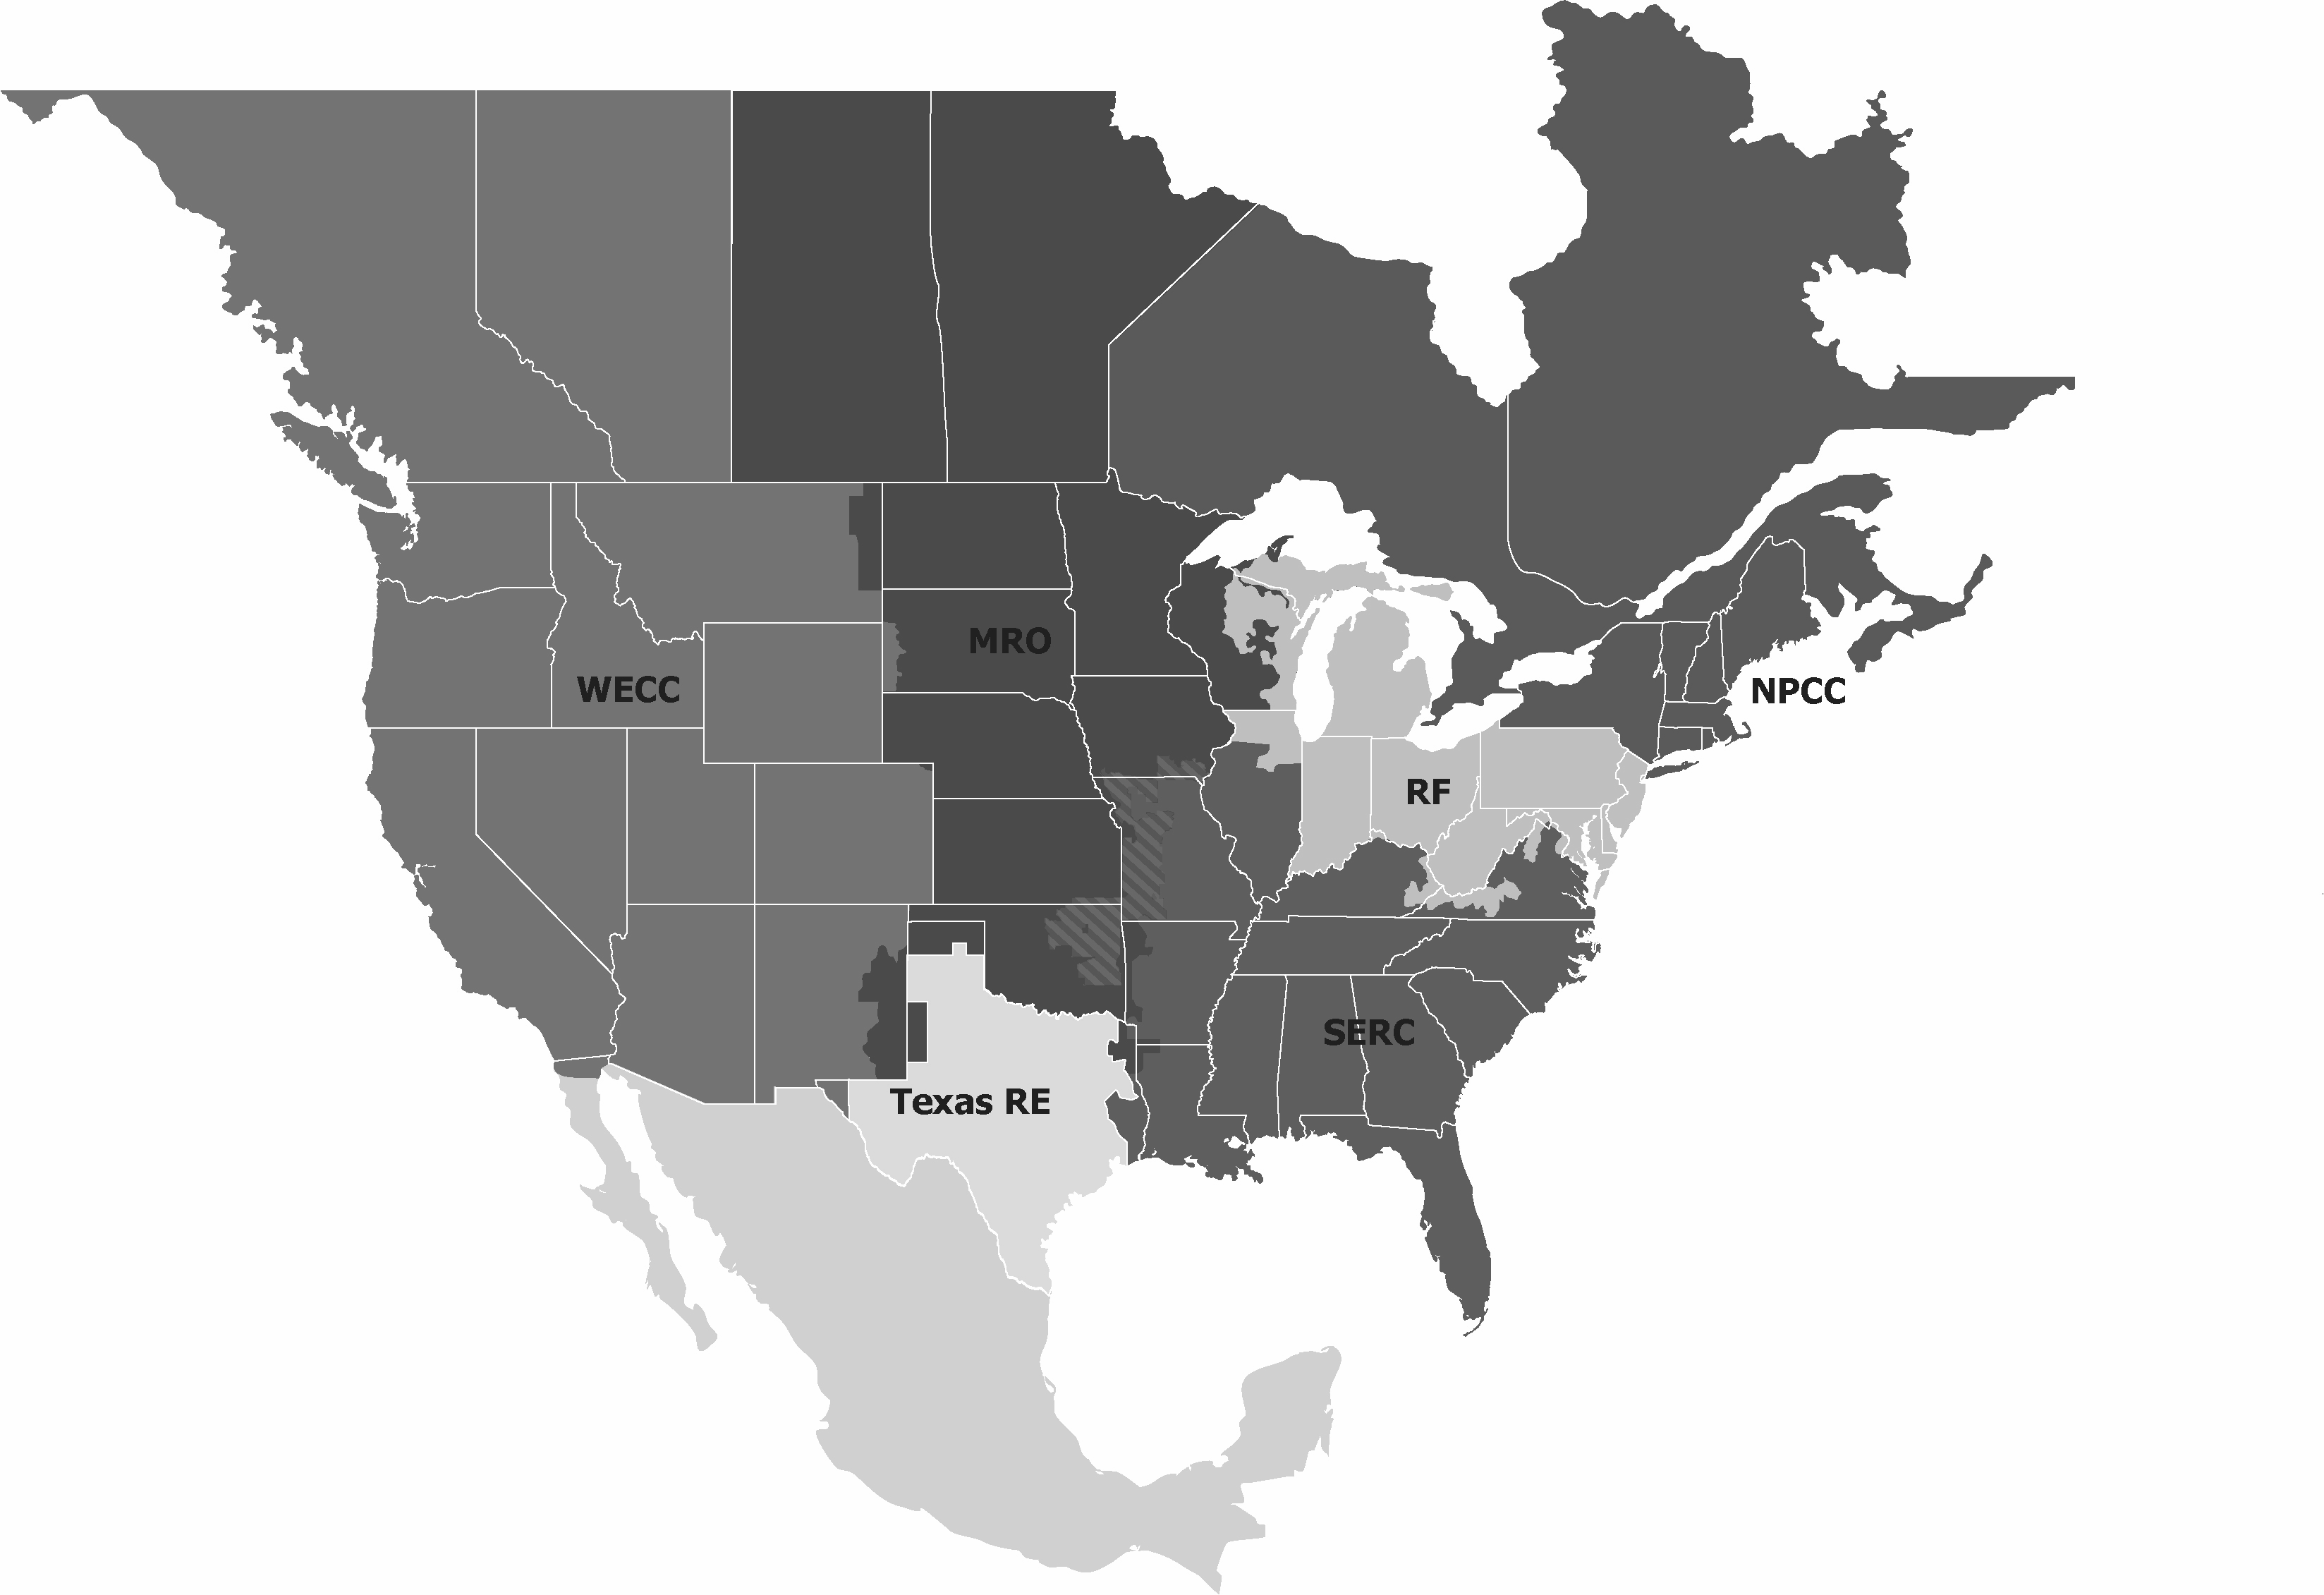

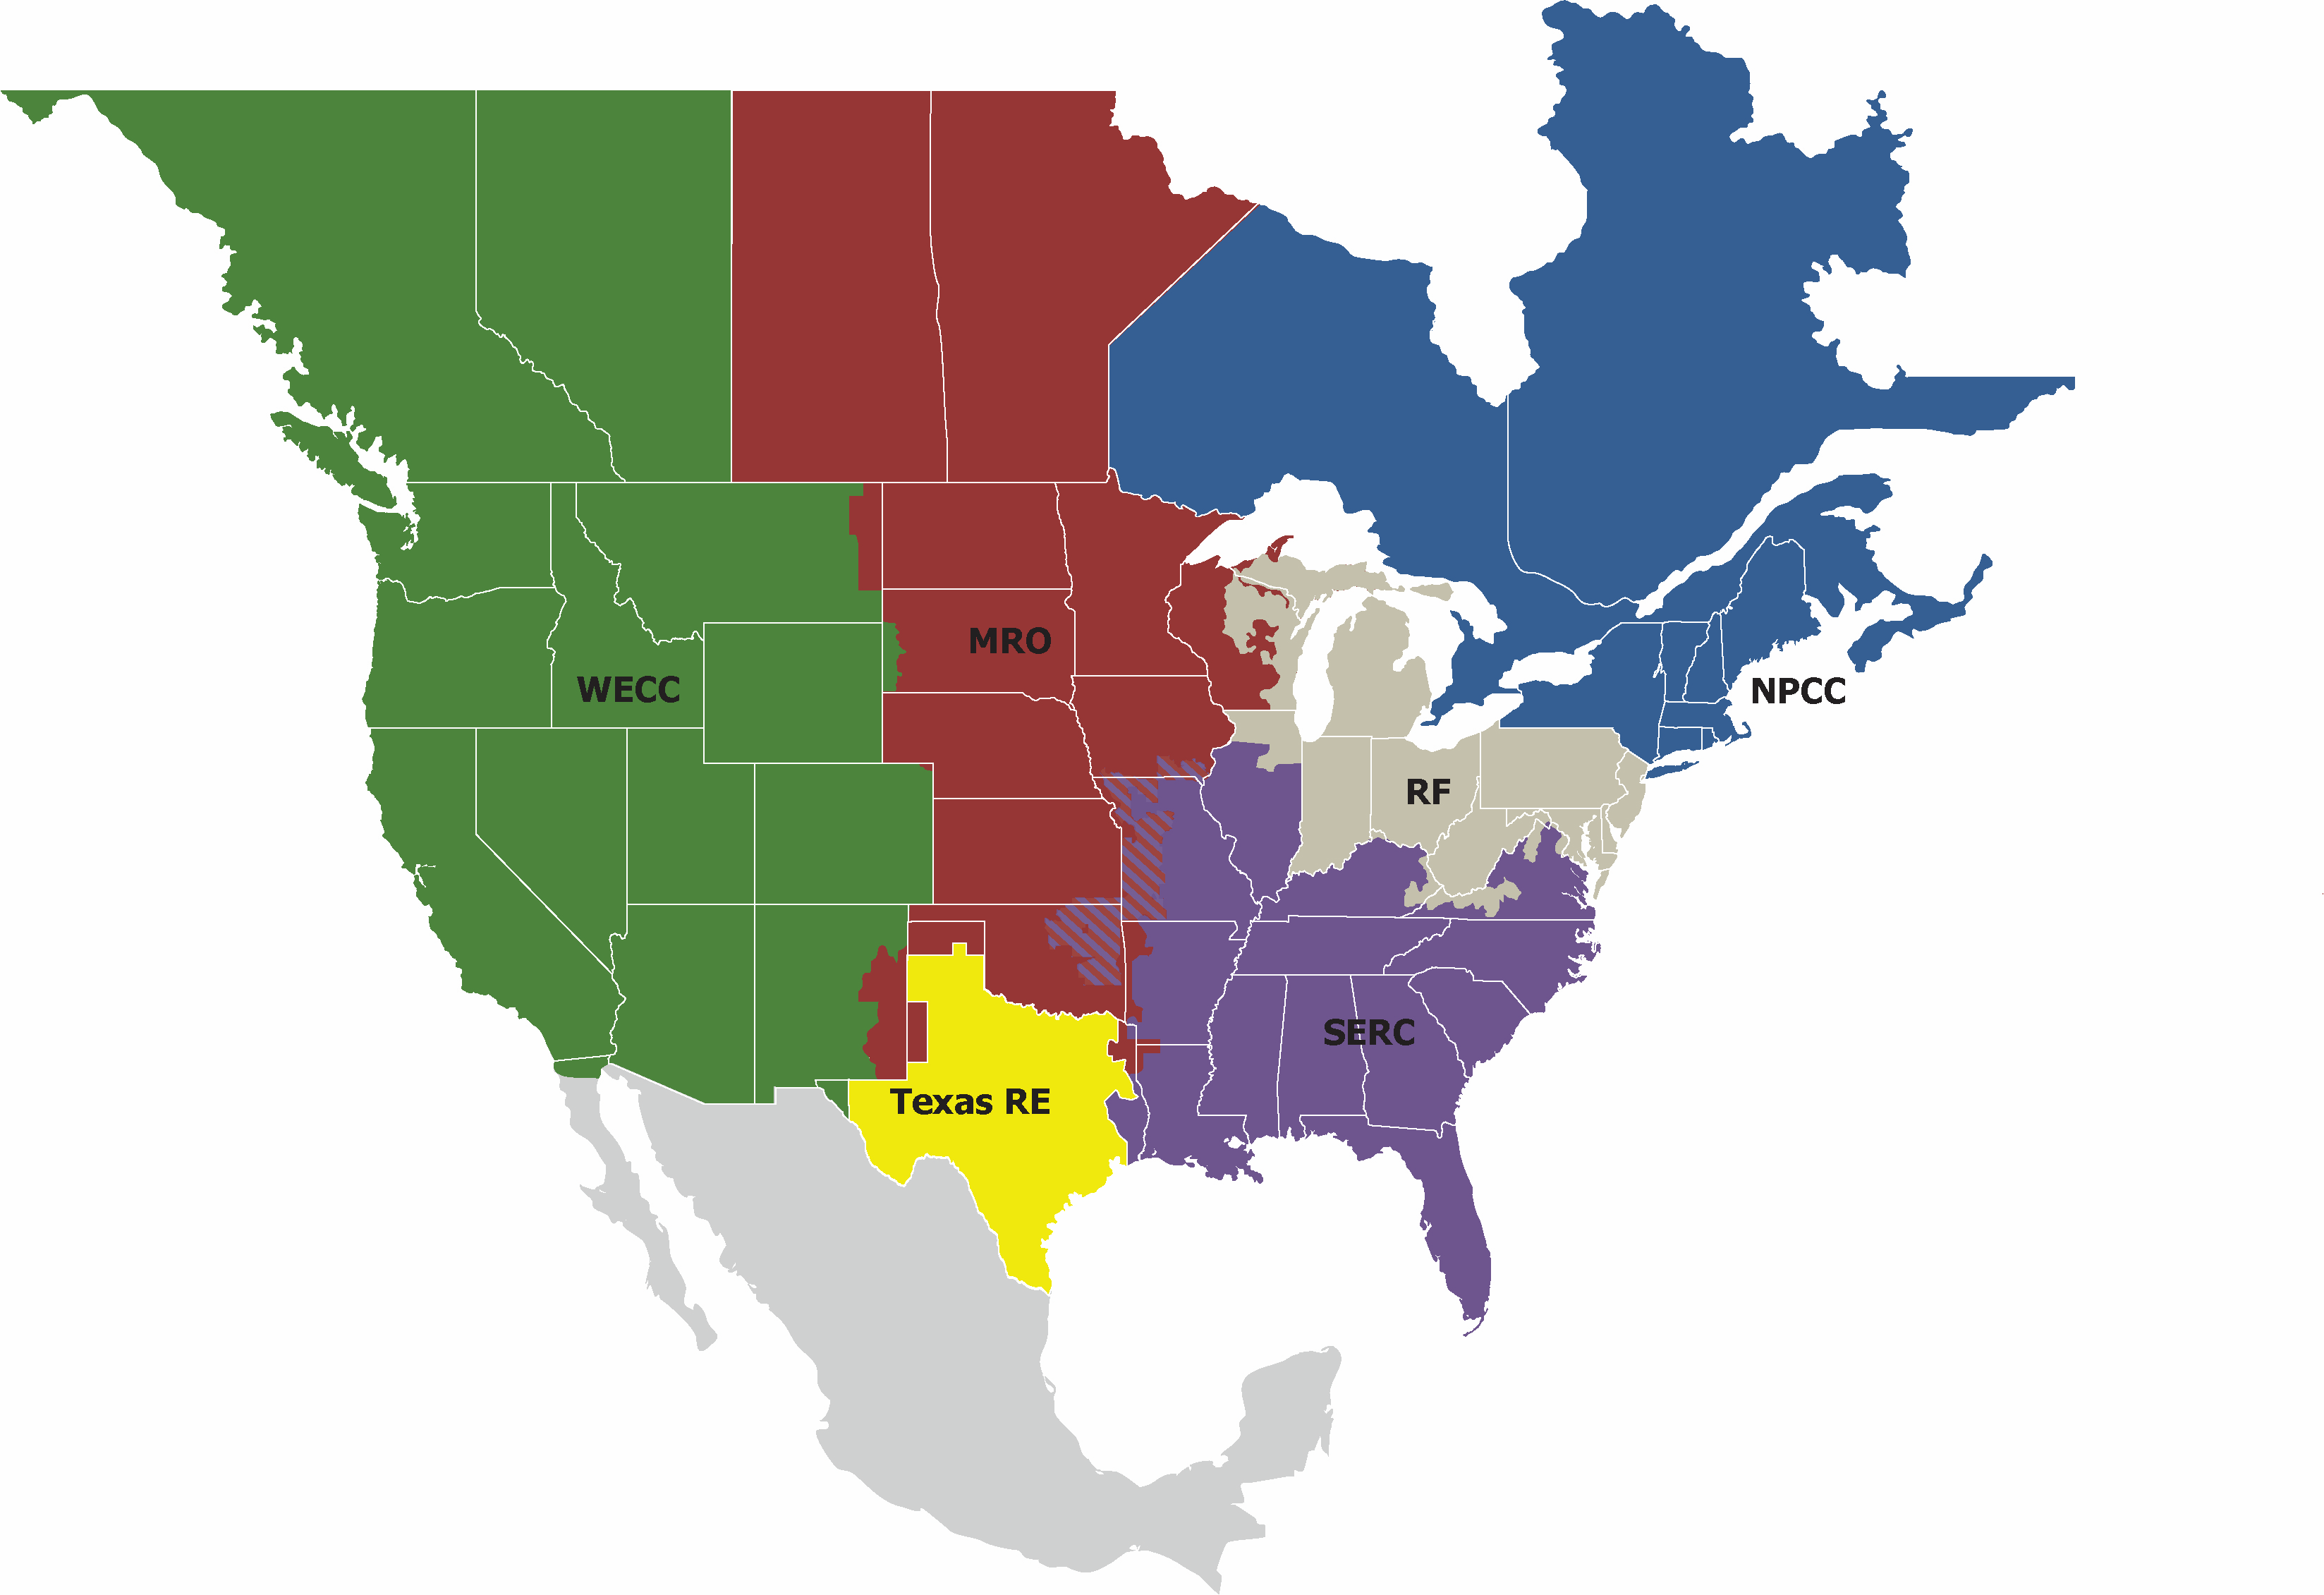

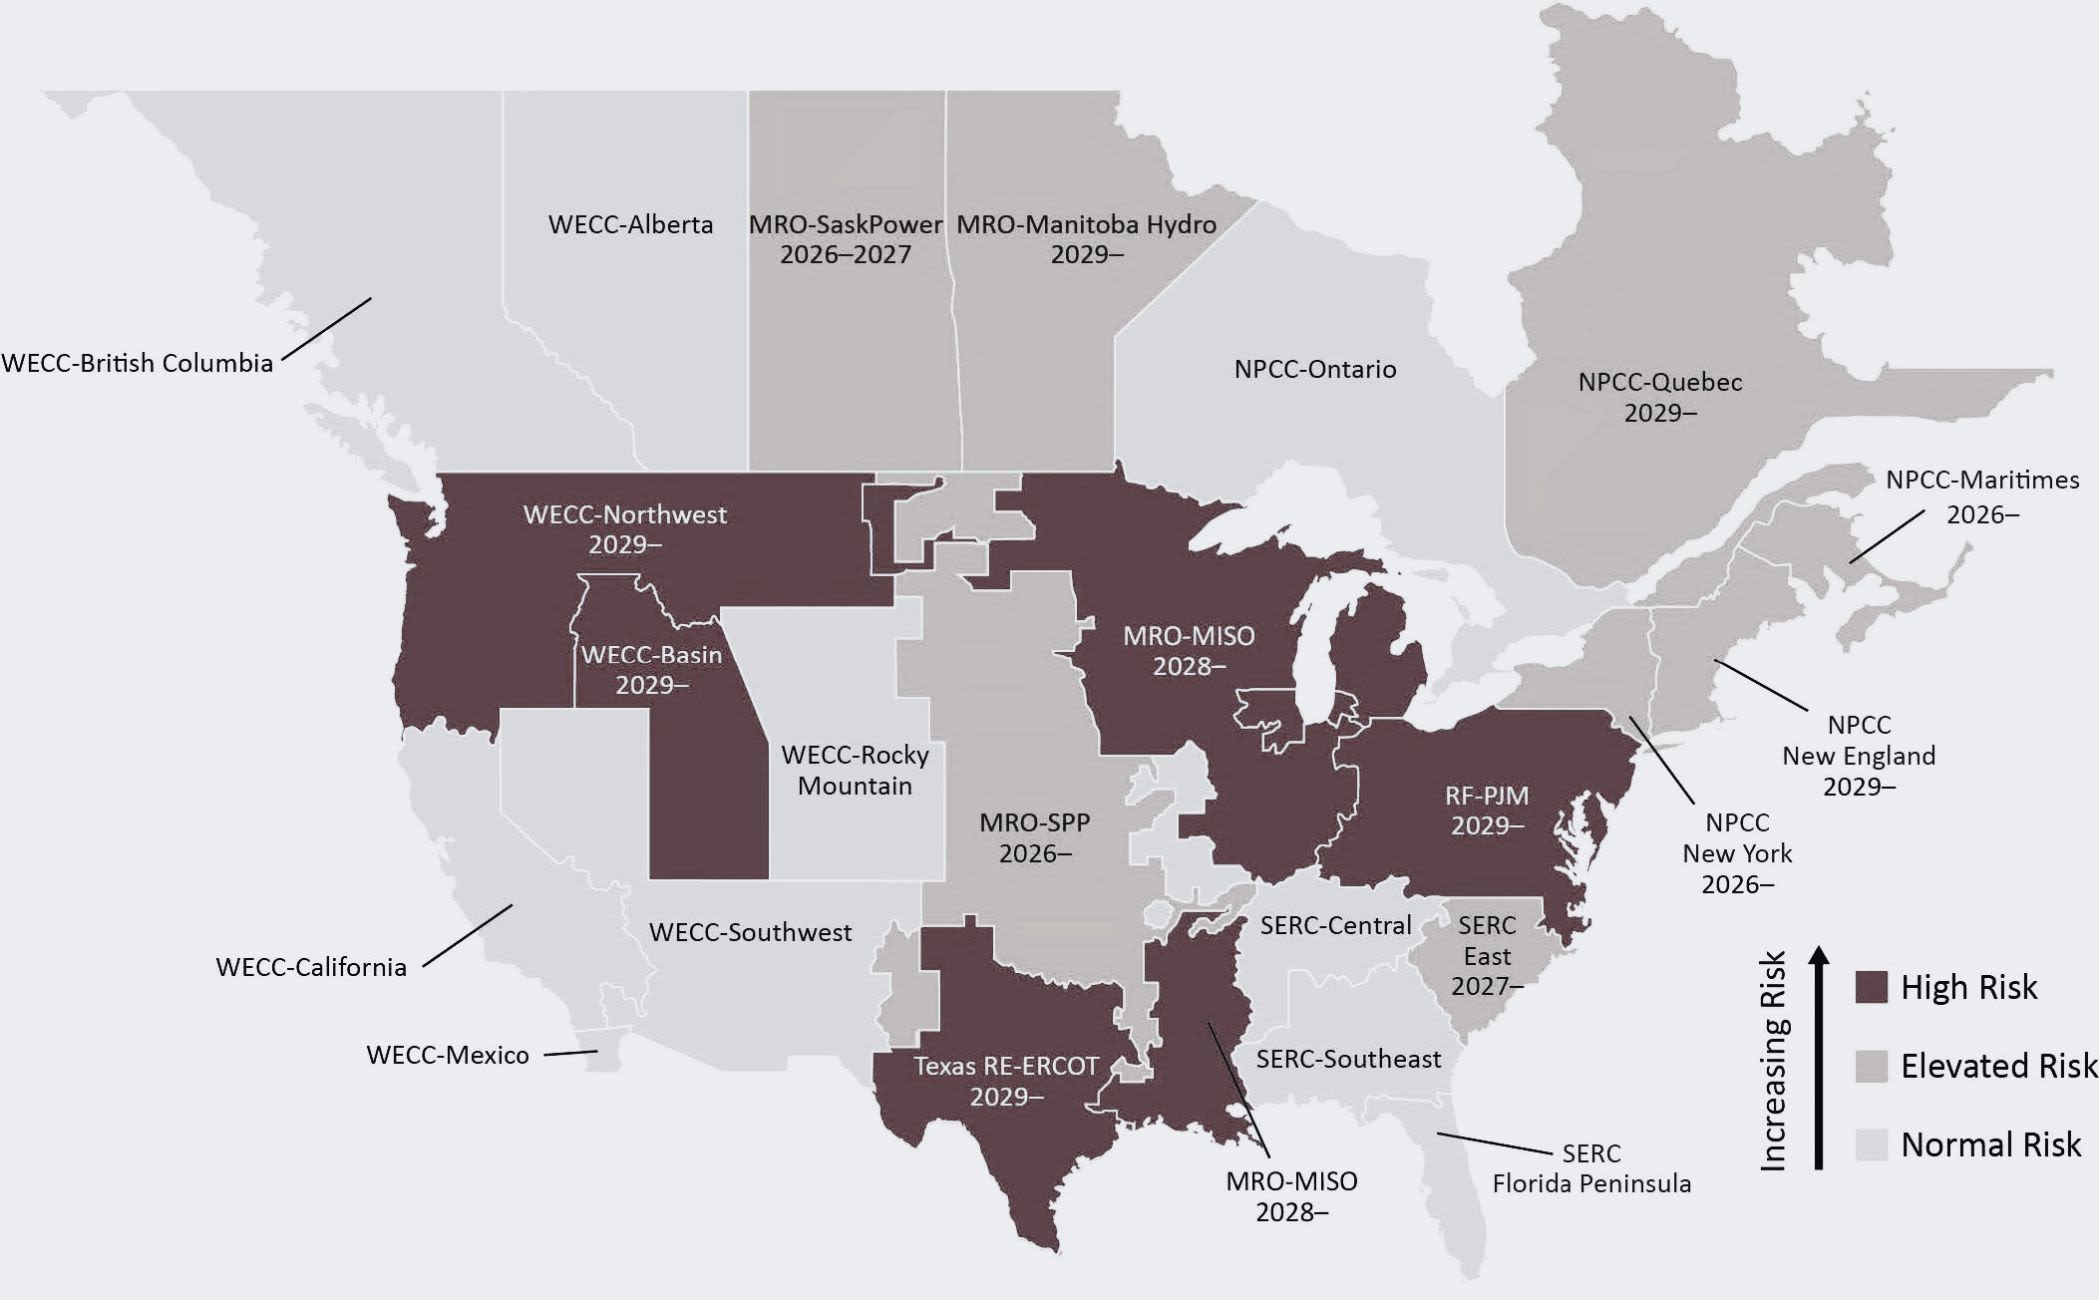

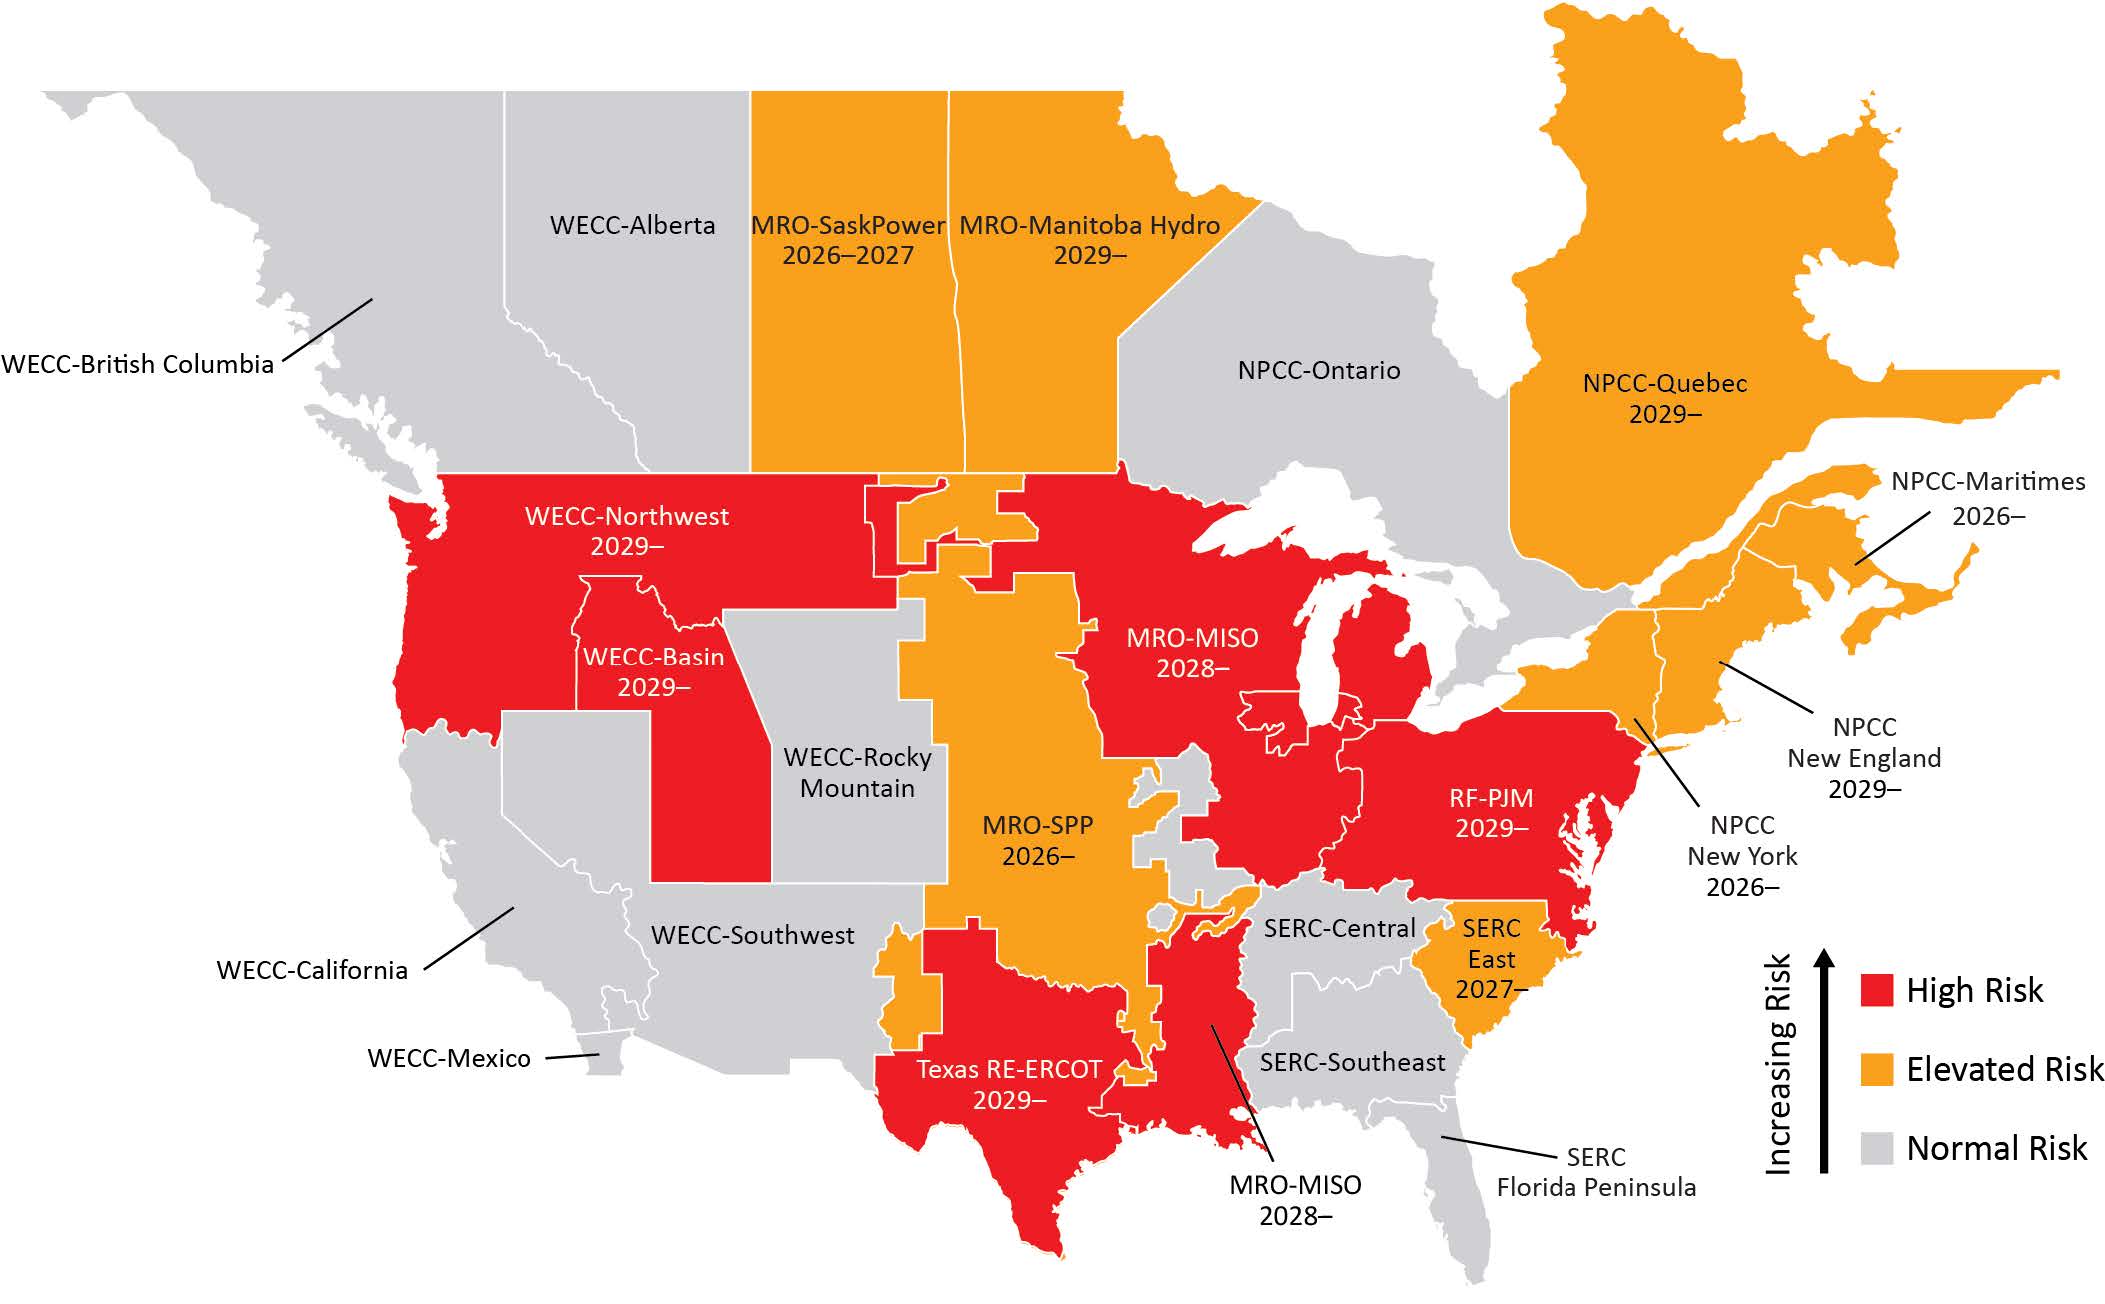
The ReliabilityFirst region includes the Great Lakes and Mid-Atlantic areas of the United States, covering parts of the PJM Interconnection (PJM) and Midcontinent Independent System Operator (MISO) Regional Transmission Organizations.
This report evaluates projected future grid reliability, load growth, changes in the generation mix, and key risks including generation retirements, policy volatility, permitting delays, and supply chain constraints. It uses data collected annually as part of NERC’s Long-Term Reliability Assessment.
The report underscores the need for proactive, coordinated action among policymakers, utilities, and stakeholders to ensure infrastructure development keeps pace with reliability requirements and avoids shortfalls that could jeopardize grid stability and affordability.
Reserve margin analyses indicate that, without timely development of new resources and mitigation of unconfirmed retirements, both PJM and MISO could face shortfalls in meeting reliability targets as early as the end of the decade. This risk level has been assessed as elevated in MISO since 2020 and in PJM since 2024.
The ReliabilityFirst region is experiencing a sharp acceleration in electricity demand, driven primarily by the rapid expansion of data centers, alongside widespread electrification and a resurgence in domestic manufacturing. Ten-year load growth forecasts indicate a significant departure from historical trends, with PJM’s summer peak demand projected to rise 36% and MISO’s summer peak demand projected to rise 15% over the next decade.
At the same time, the generation mix is undergoing a major transformation, with coal and natural gas retirements offset by substantial growth in solar, wind, battery, and hybrid resources. However, the certainty and timing of new resource additions remains somewhat unclear due to construction delays. PJM anticipates 12 GW of confirmed capacity growth and there are more than 74 GW of additional generation resources in its queue, though only a portion of those resources is likely to be built. MISO expects 3.6 GW of confirmed capacity growth and up to 22 GW of potential new generation resources in its queue.
Resource adequacy is further challenged by rapid shifts in energy policy, permitting delays, supply chain constraints, and economic conditions, which collectively slow the deployment of critical infrastructure. Current delivery timelines are delayed three to five years for turbines and up to two years for transformers, compounding project costs and creating timing mismatches between retiring generation and replacement capacity. Extreme weather also poses risks to both generation and transmission assets.
ReliabilityFirst emphasizes the need for coordinated action among policymakers, utilities, and stakeholders to align infrastructure development with reliability needs. This includes refining load forecasting methods, accelerating resource development, enhancing transmission planning and studying the need for additional interregional transfer capability. Proactive measures will be essential to maintain reliability, affordability, and sustainability as demand continues to grow.


Resource Planning &
Scenario Analysis


This report analyzes the adequacy of generation resources to serve anticipated load demand for the next 10-year period under a range of different scenarios and assumptions. Each assessment area within ReliabilityFirst (i.e., PJM and MISO) has a targeted reserve margin level, which identifies the amount of megawatts needed to meet a loss of load expectation (LOLE) of one day in 10 years. This analysis shows each area’s ability to meet the targeted reserve margin level.


Key drivers include policy decisions at the federal, state, and local levels; supply chain disruptions; economic conditions such as the ability to maintain financial backing and tariff structures; and the availability of skilled labor.
A diverse set of factors is influencing shifts in the resource mix, which can affect both the types of resources seeking grid interconnection and those approaching retirement. Key drivers include policy decisions at the federal, state, and local levels; supply chain disruptions; economic conditions such as the ability to maintain financial backing and tariff structures; and the availability of skilled labor. Due to these impacts, planners use varying resource scenarios to gauge how changes in the potential generation category (i.e., generation that is yet to be built) and unconfirmed retirements may impact an area’s ability to stay above the reserve margin.
Scenario Analysis #1:
Reserve margin projections with existing and planned resources only vs. addition of potential resources
Figure 1 shows the reserve margin projections for PJM from 2026 through 2035. The blue line represents PJM’s reserve margin with both existing and planned resources. This displays the risk of confirmed retirements and increasing load without the addition of potential resources. Based on these conditions, PJM may not be able to meet its reserve margin starting in 2029 and beyond.
The red line represents PJM’s reserve margin with existing, planned, and all projected potential resources currently in PJM’s queue. Note that with these resources included in the PJM resource mix, PJM is projected to meet its reserve margin target beyond 2035. While not all queued capacity is expected to come online, the outlook underscores the PJM area’s strong need for maintaining reliability through continued resource development.
Figure 2 shows MISO’s reserve margin from 2026 to 2035. The blue line indicates the margin with only existing and planned resources, highlighting a projected shortfall starting in 2030 due to confirmed retirements and rising demand.
The red line reflects the addition of all potential resources in MISO’s queue. While not all this capacity is expected to come online, even under optimistic scenarios, MISO may face challenges in meeting its reserve margin beyond 2033. This underscores the importance of continued investment, timely development, and supportive policy frameworks to ensure reliability across the MISO area.

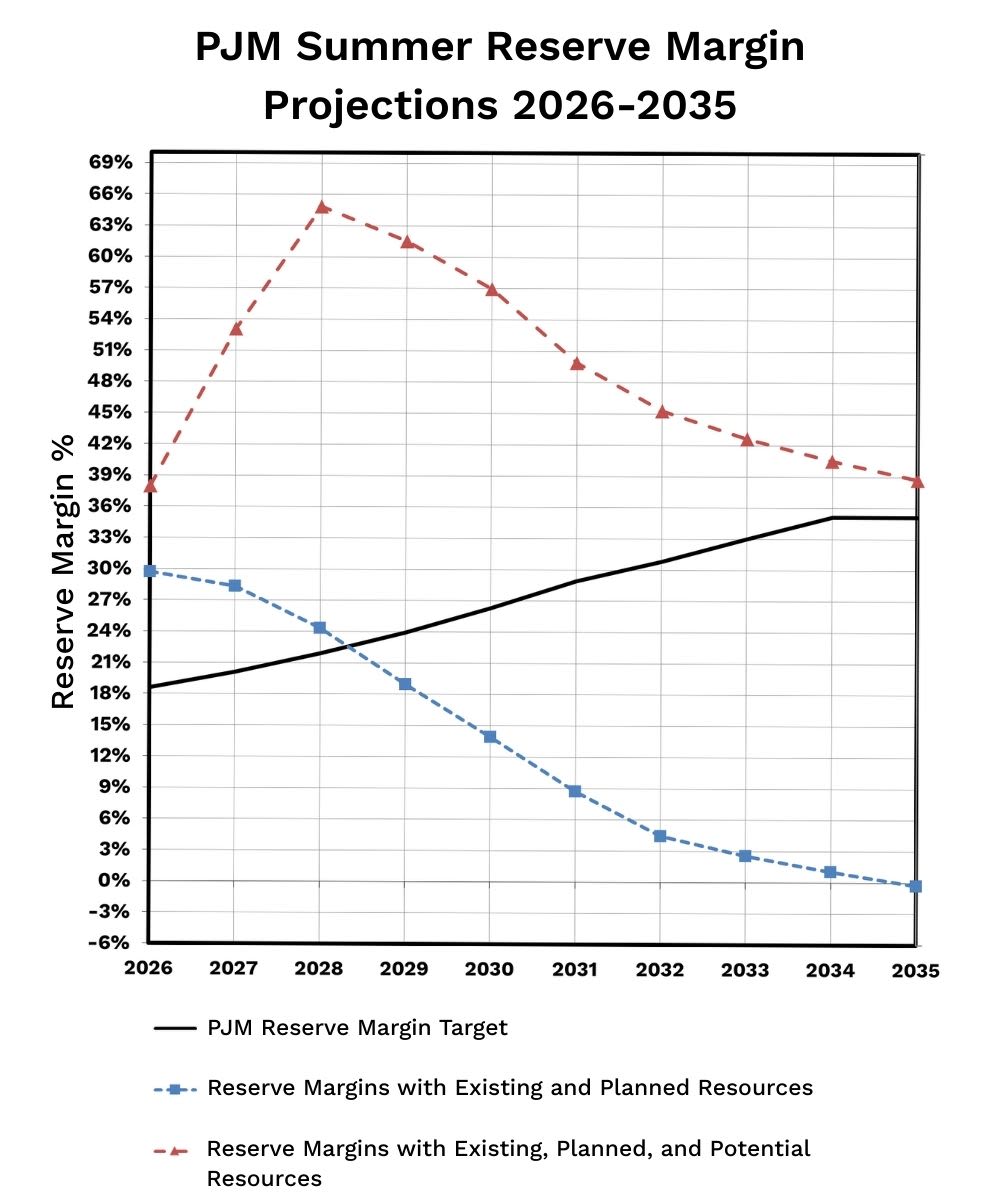
Figure 1
Figure 1
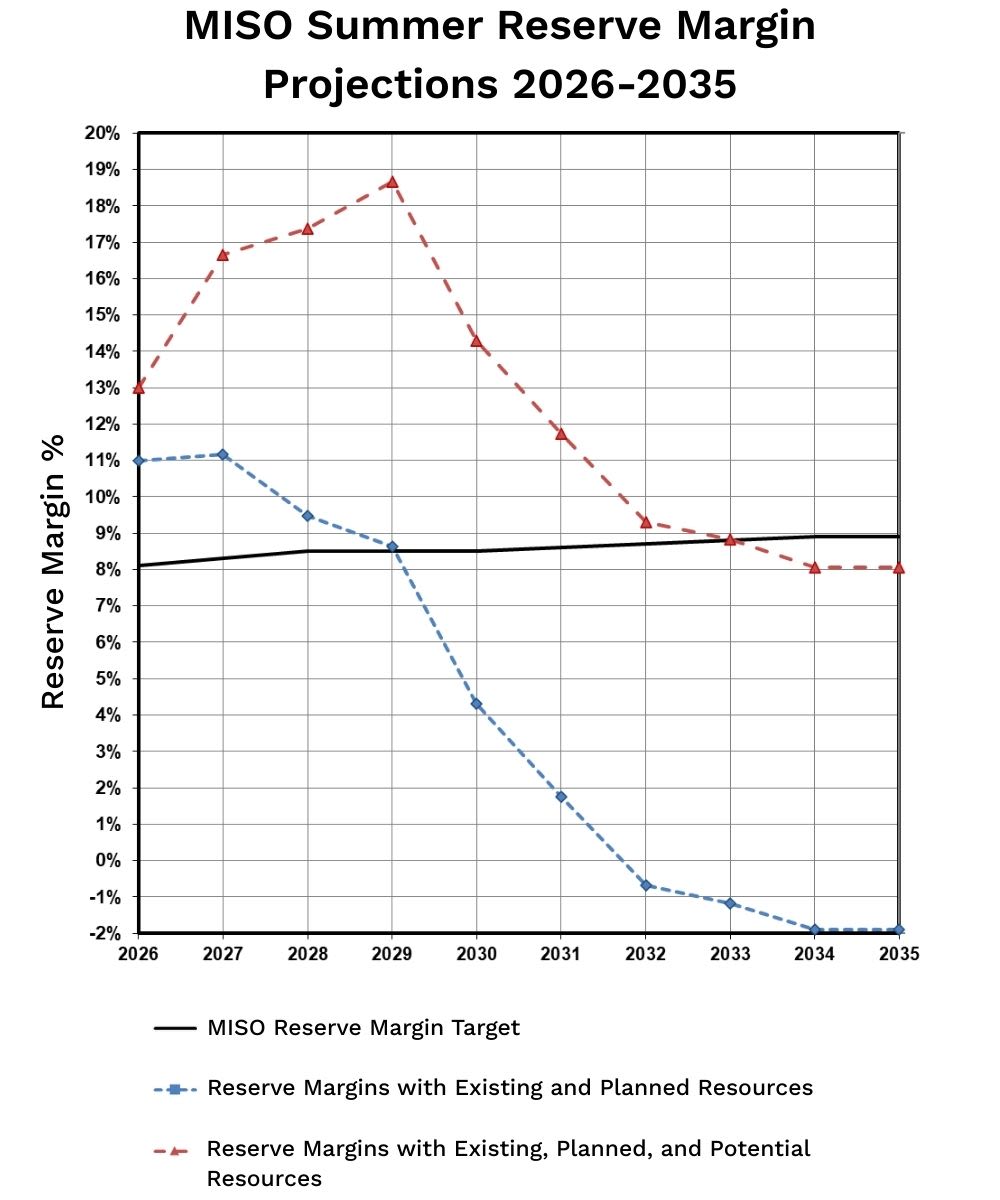
Figure 2
Figure 2
Scenario Analysis #2:
Reserve margin projections comparison including potential impact from unconfirmed retirements
If all potential resources connect on the grid when expected, PJM could meet its reserve margin beyond 2035. However, PJM could experience unconfirmed retirements for coal and natural gas resources in the amount of 22 GW between 2026 and 2035. The orange line in this figure shows that in this scenario PJM could struggle to meet its reserve margin starting in 2032.
In addition to unexpected retirements, PJM may experience only a portion of potential resources connecting to the grid, which is represented in the scenario as 30%. When this is combined with unconfirmed retirements, the projected reserve margin shortfall accelerates to 2029, shown by the green line.
If all existing, planned, and potential resources interconnect on the MISO system, MISO could meet its reserve margin until 2033. However, if there is a reduction in potential resources, MISO may not meet its reserve margin in 2030 and beyond. MISO does have resources beyond what has been provided in its potential category that could assist in alleviating this shortfall.
Based on retirements reported via the U.S. Energy Information Administration (EIA) in0 Form EIA-860M, MISO could experience 19 GW of resource capacity retirements between 2026 and 2035. If these unconfirmed retirements materialize, then MISO may struggle to meet its reserve margin starting in 2028 and beyond.
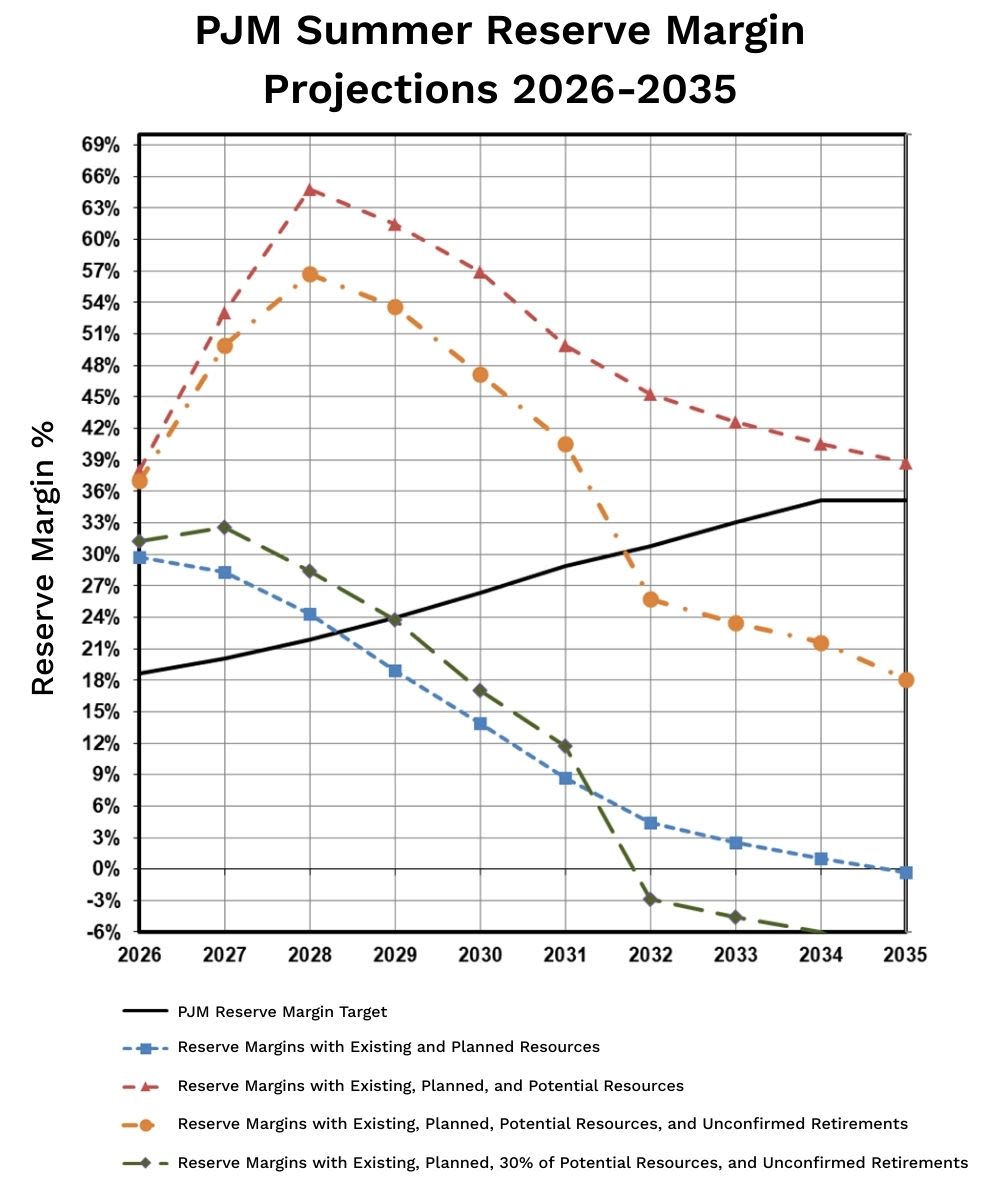
Figure 3
Figure 3
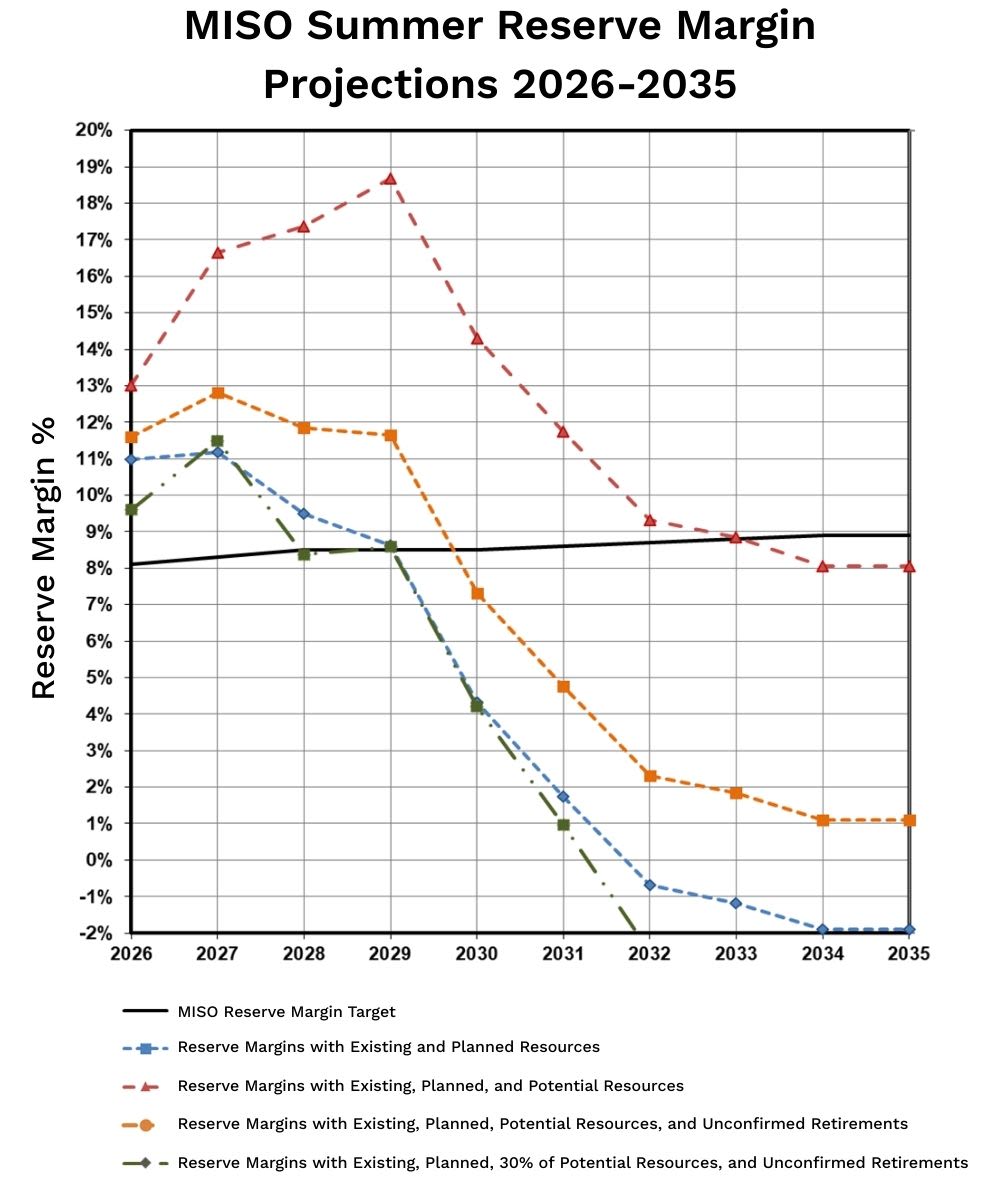
Figure 4
Figure 4
Additional resources needed to meet reserve margins
The next step in the resource adequacy analysis is to take the surplus or deficit of resources identified for each scenario above and estimate the additional potential resources needed to close the gap and meet the reserve margin.

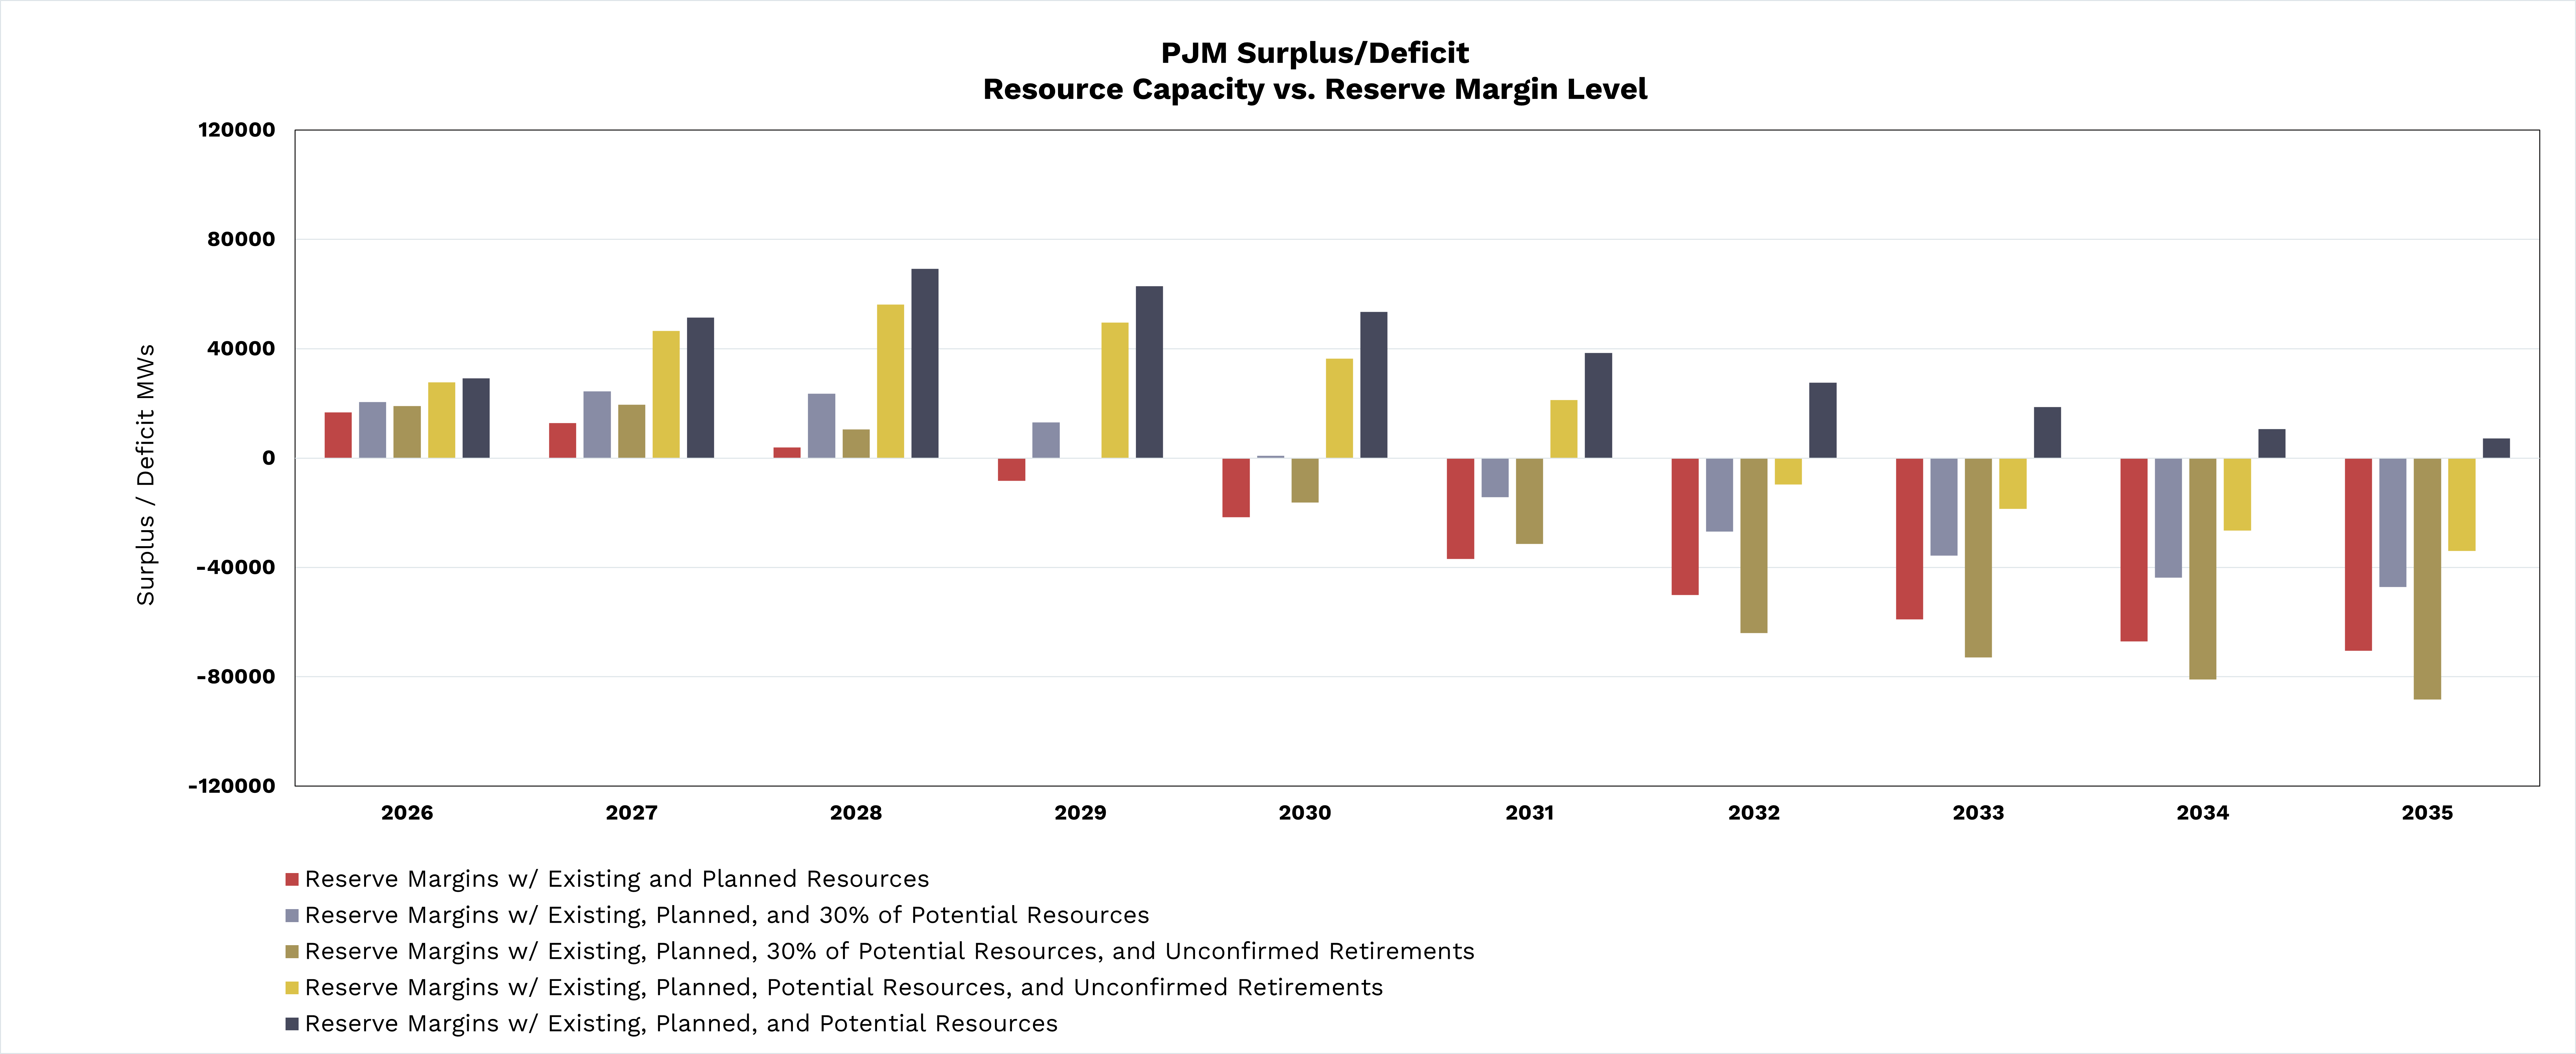
Figure 5
Figure 5
In 2035, if no unconfirmed retirements materialize, PJM will need approximately 71 GW in resource capacity to meet its reserve margin, which equals 91% of its potential resources. However, if in 2035 PJM sees only 30% of its potential resources come online and has unconfirmed retirements, then 88 GW of resource capacity will be required to meet its reserve margin. While this scenario represents a worst-case scenario for PJM, current projections show its potential resources available in 2035 fall short of what it will need.

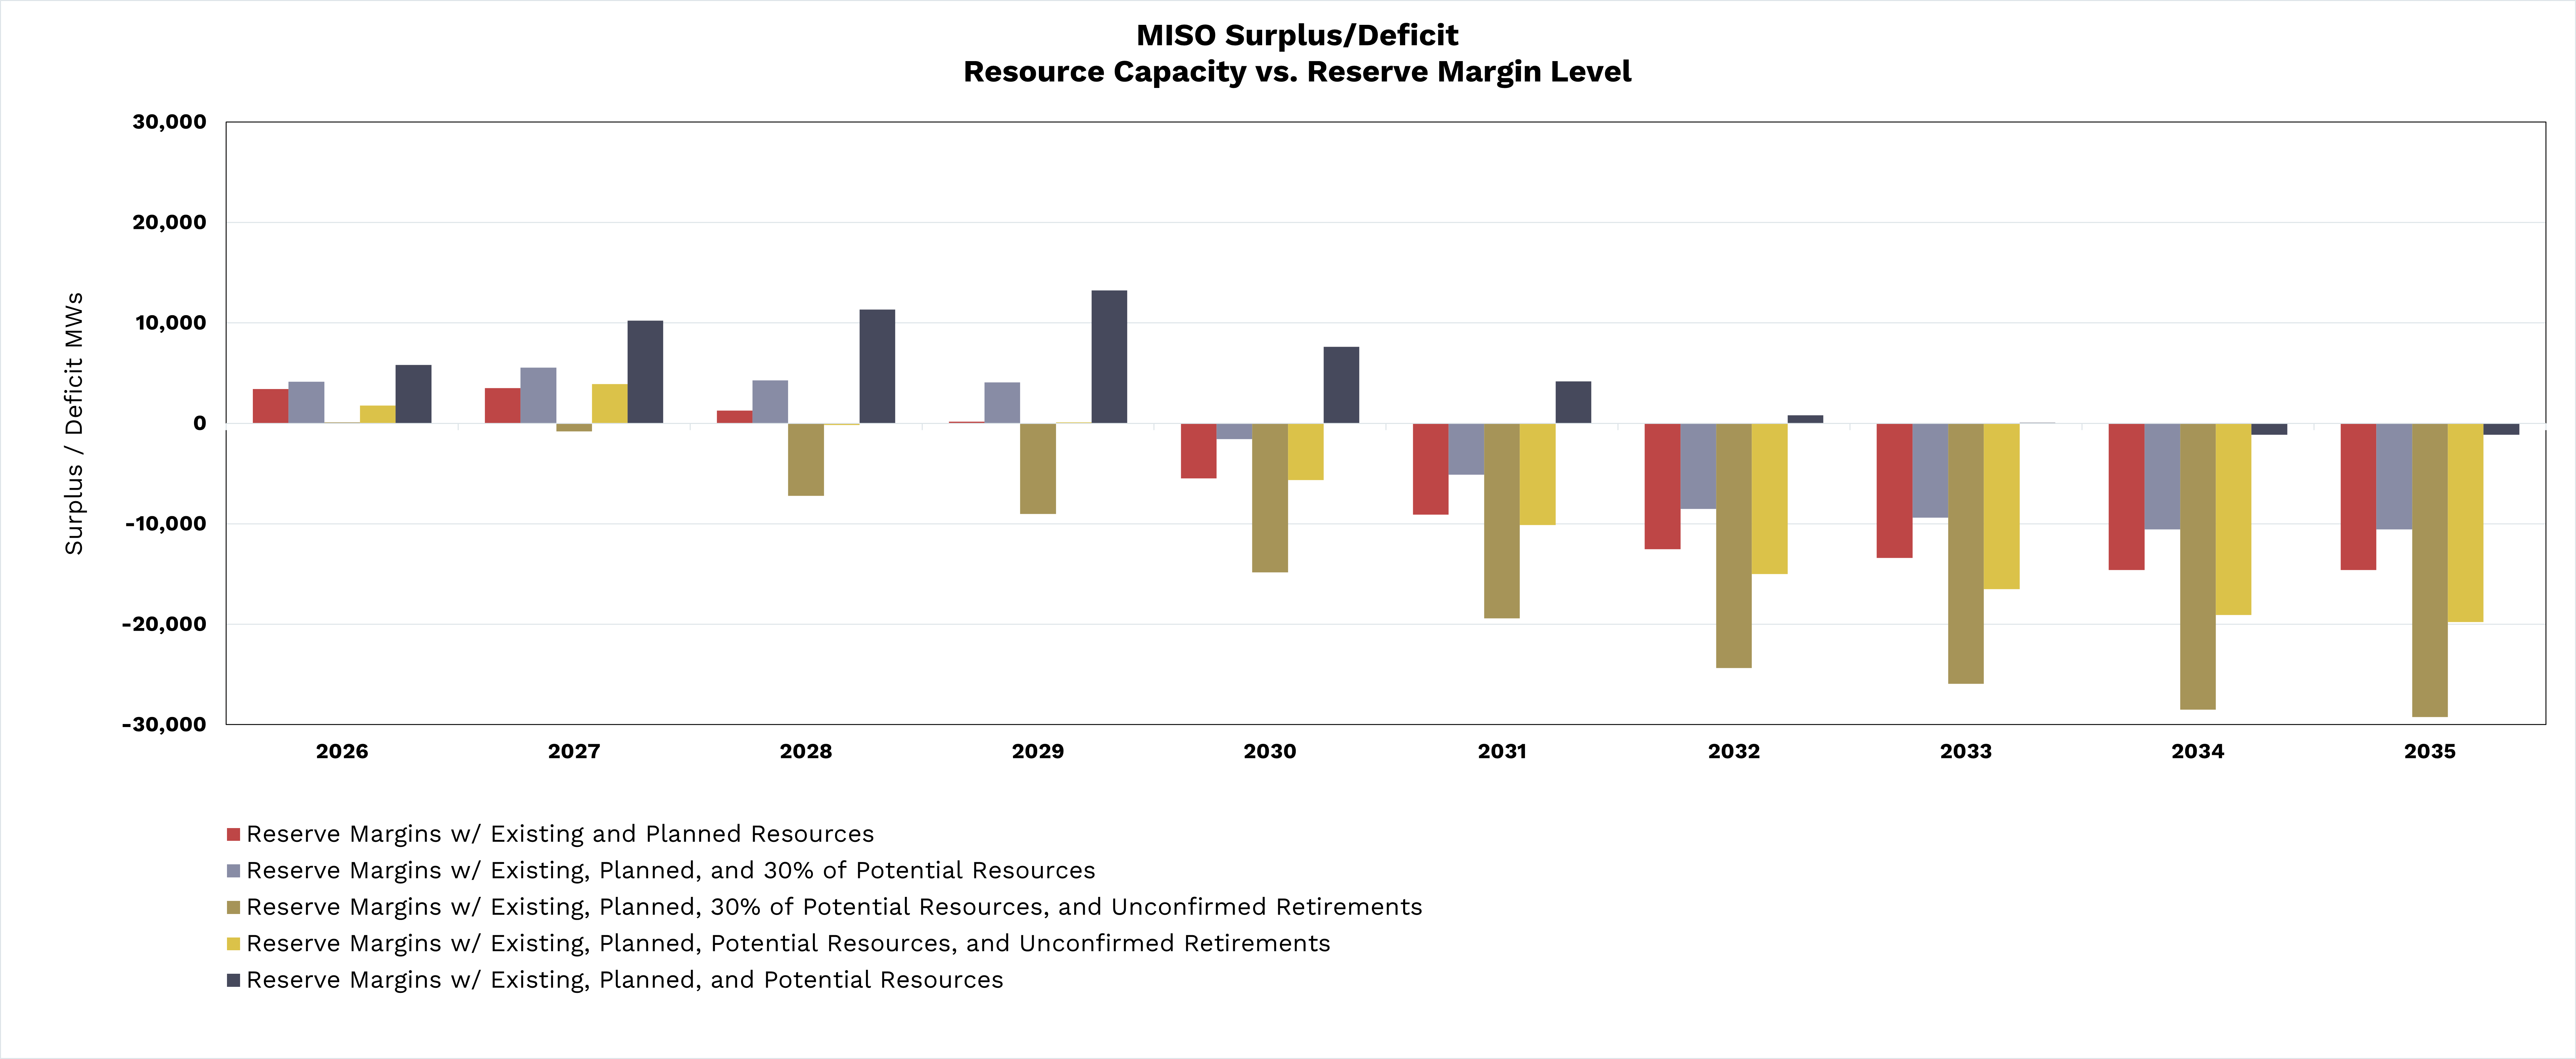
Figure 6
Figure 6
Figure 6 identifies the surplus or deficit of resources for each MISO scenario shown above in Figure 4, with an estimate of the additional potential resources needed to meet the reserve margin. In 2035, if no unconfirmed retirements materialize, MISO would need approximately 15 GW in resource capacity to meet its reserve margin. In 2035, if MISO experiences unconfirmed retirements, then MISO would need 20 GW of resource capacity to meet its reserve margin.
This analysis indicates that to meet reserve margins in the future, both PJM and MISO may need to employ a combination of delaying retirements of coal and natural gas resources and increasing queued generation resources and firm transmission transfer capability.
Key takeaways
PJM may not meet its reserve margin starting in 2029 if only existing and planned resources are considered, due to confirmed retirements and rising demand. Including all potential resources in the queue, PJM is projected to meet its reserve margin target beyond 2035, though not all queued capacity is expected to come online.
Unconfirmed retirements could cause PJM to struggle to meet its reserve margin starting in 2032, and if only 30% of potential resources connect, the shortfall could begin as early as 2029.
In 2035, PJM will need 71 GW of resource capacity to meet its reserve margin if no unconfirmed retirements occur (91% of potential resources). If only 30% of potential resources connect and unconfirmed retirements occur, 88 GW will be needed—exceeding projected potential resources.
MISO faces a projected shortfall starting in 2030 with only existing and planned resources. Even with all potential resources, MISO may still face challenges meeting its reserve margin beyond 2033, highlighting the need for continued investment and supportive policies.
Reductions in potential resources or unconfirmed retirements could cause shortfalls for the MISO area as early as 2028. In 2035, MISO would need 15–20 GW of additional resource capacity to meet its reserve margin, depending on retirements.
Both PJM and MISO may need to delay retirements of coal and natural gas resources, increase the number of queued generation resources that come online, and enhance firm transmission transfer capability to maintain reliability and meet reserve margins in the future.


Load growth
Five-year forecasts for the ReliabilityFirst region project a sharp acceleration in load growth, marking a significant departure from what had previously been a more gradual increase in load. This surge is driven primarily by the proliferation of data centers, alongside widespread electrification of buildings and vehicles, and a resurgence in domestic manufacturing. These shifts introduce new layers of uncertainty in forecasting resource adequacy, planning, and operations across both PJM and MISO.
Seasonal demand
PJM forecasts a 36% peak demand increase by 2035, as shown in Figure 7. The PJM area (which experiences annual peak demand during the summer) anticipates an increase in peak demand from 154 GW to 210 GW over the next 10 years. This corresponds to an average annual load growth rate of 3%. The winter forecast is similar, with a projected 43% increase between 2025 and 2035.
MISO forecasts a 15% peak demand increase by 2035, as shown in Figure 8. The MISO area (which also experiences annual peak demand during the summer) anticipates an increase in peak demand from 125 GW to 144 GW over the next 10 years. This corresponds to an average annual load growth rate of 1.5%.
MISO’s anticipated winter load forecast projects 19% growth between 2025 and 2035. Although both PJM and MISO’s winter forecasts project to follow a similar trajectory, the difference between summer and winter forecast demand is larger in the MISO area (20 GW) than in the PJM area (15 GW).
A wide seasonal gap between summer and winter peak demand could indicate greater variability, requiring robust resource planning, efficient capacity utilization, and strategies to manage reliability and cost impacts.
Annual forecast comparison
For PJM, when comparing forecasts completed in 2021 to the most updated forecast completed in 2025, the anticipated peak demand has significantly increased, mainly due to a large number of data center connections.
The latest forecast indicates that 2034 demand is now expected to be roughly 30 GW higher than it was in last year’s projection, as shown in Figure 9.
To put that increase into perspective, 30 GW roughly powers all of the homes in both Ohio and Pennsylvania combined.


Anticipated demand in the MISO area has also significantly increased when comparing the forecasts completed in 2021 to the forecast completed in 2025, mainly due to data center connections and electrification. When comparing just the 2024 to 2025 forecasts, the projected demand for 2034 has jumped by 12 GW, as shown in Figure 10.
Given the significant projected demand growth over the next decade, ReliabilityFirst is closely monitoring long-term load forecasts to identify potential risks where demand could outpace available resources.
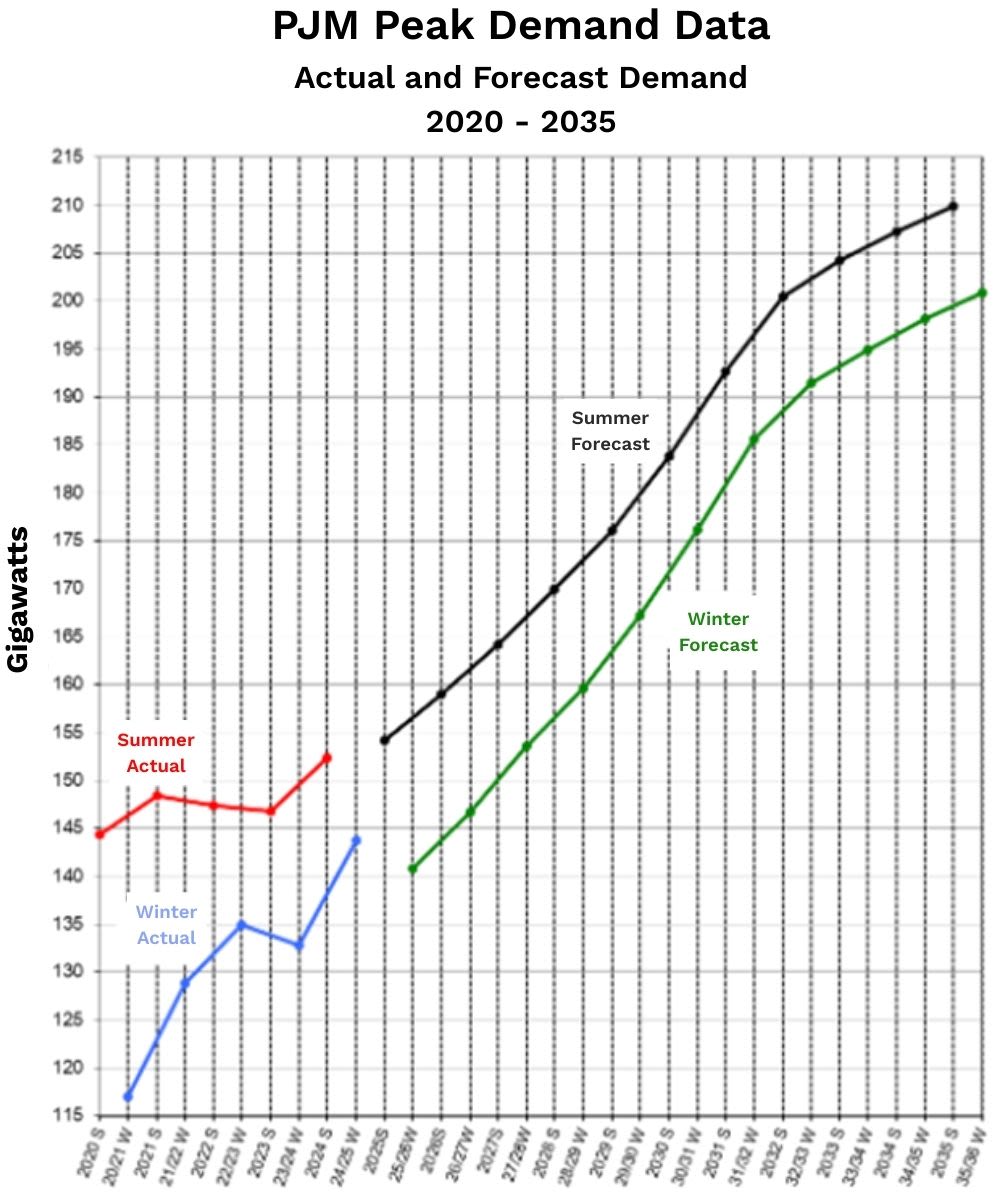
Figure 7
Figure 7
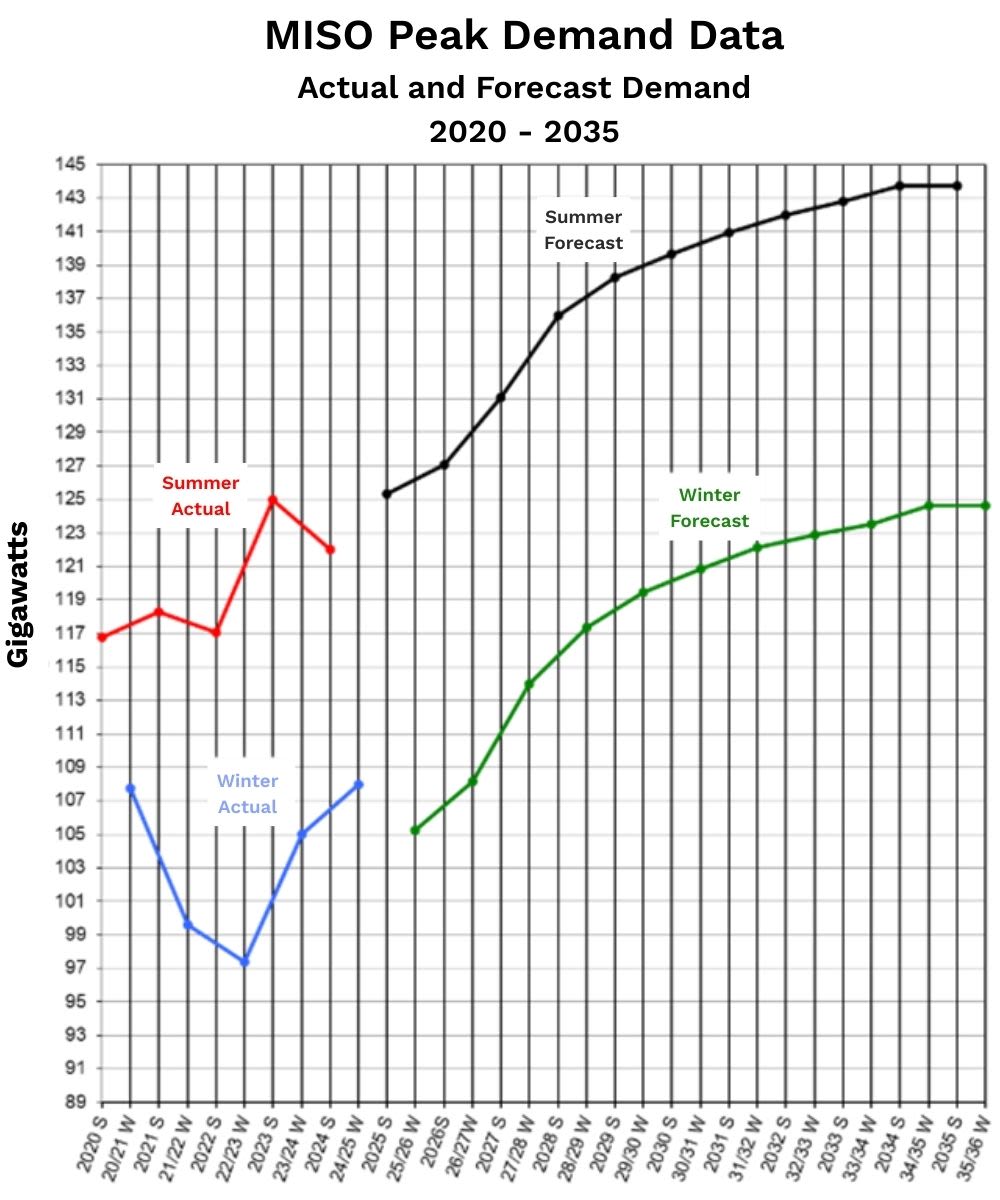
Figure 8
Figure 8
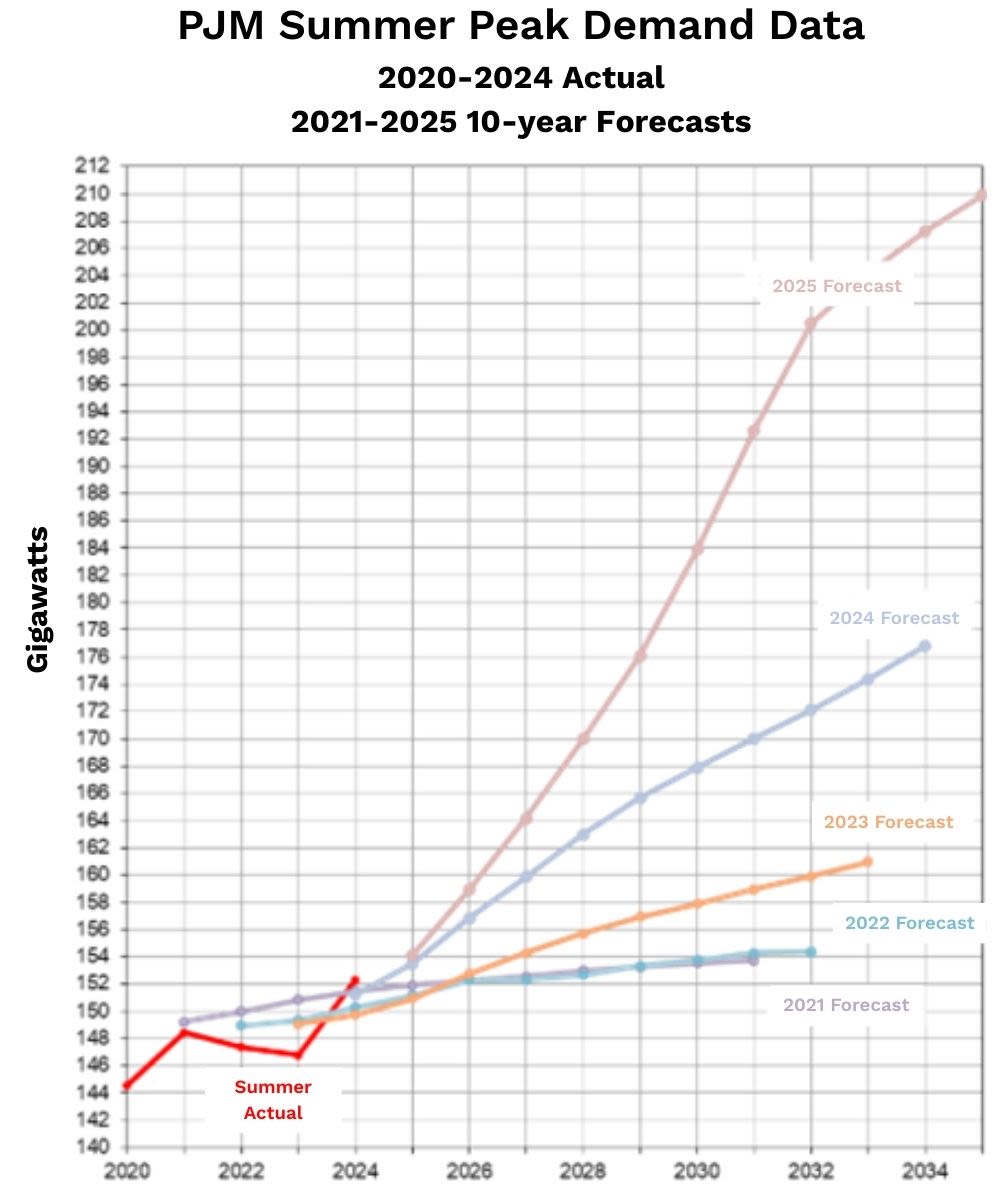
Figure 9
Figure 9
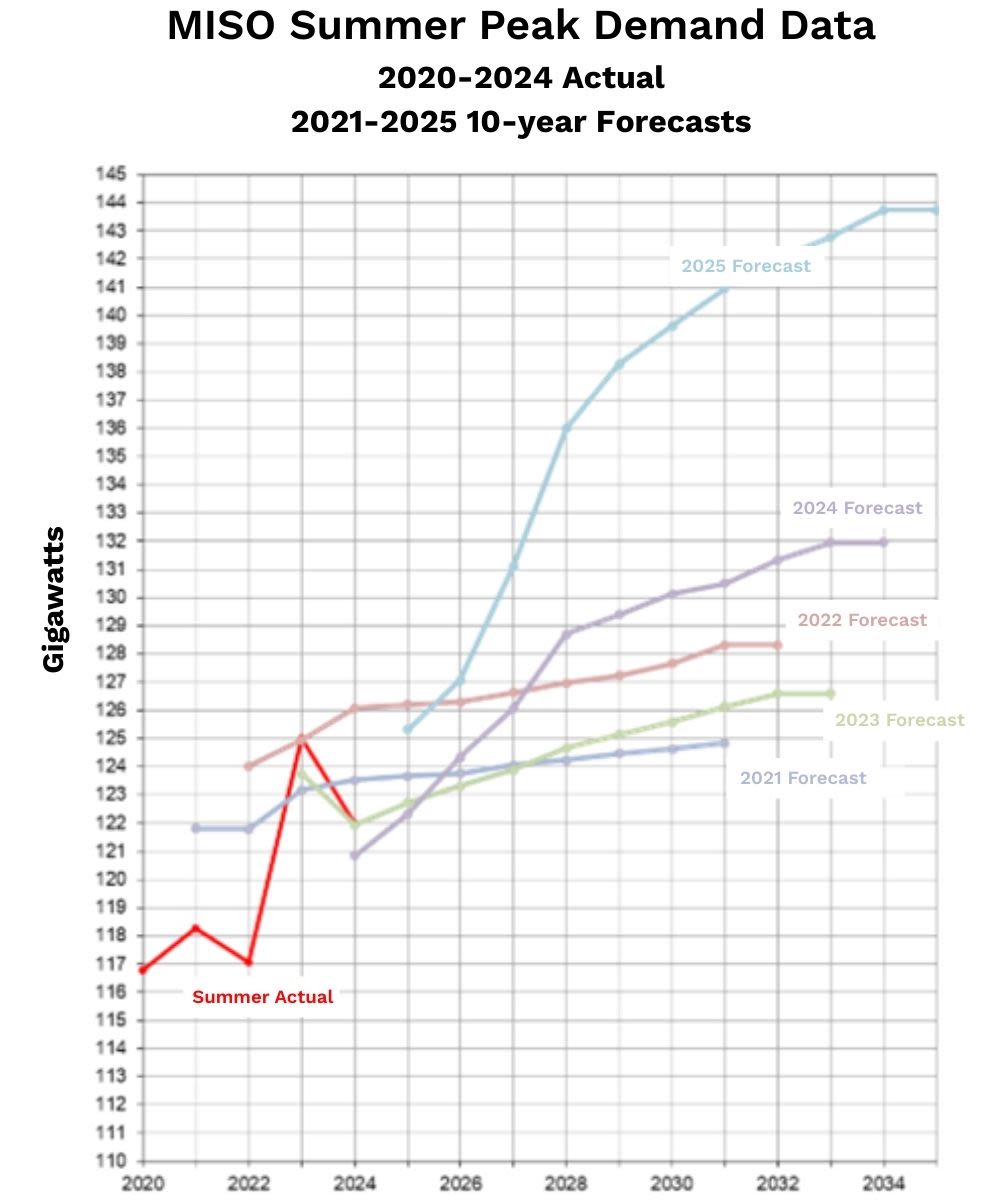
Figure 10
Figure 10
Load forecast accuracy
ReliabilityFirst studied the historical accuracy of load forecasts to add further context when studying projected load on the system. Accurate load forecasts are essential for ensuring grid reliability and cost efficiency. They guide decisions on generation, transmission, and infrastructure investments, helping to avoid both shortages and unnecessary overbuilding. Precise forecasts also support market operations, pricing stability, and integration of new resources, making them critical for long-term planning and risk management.

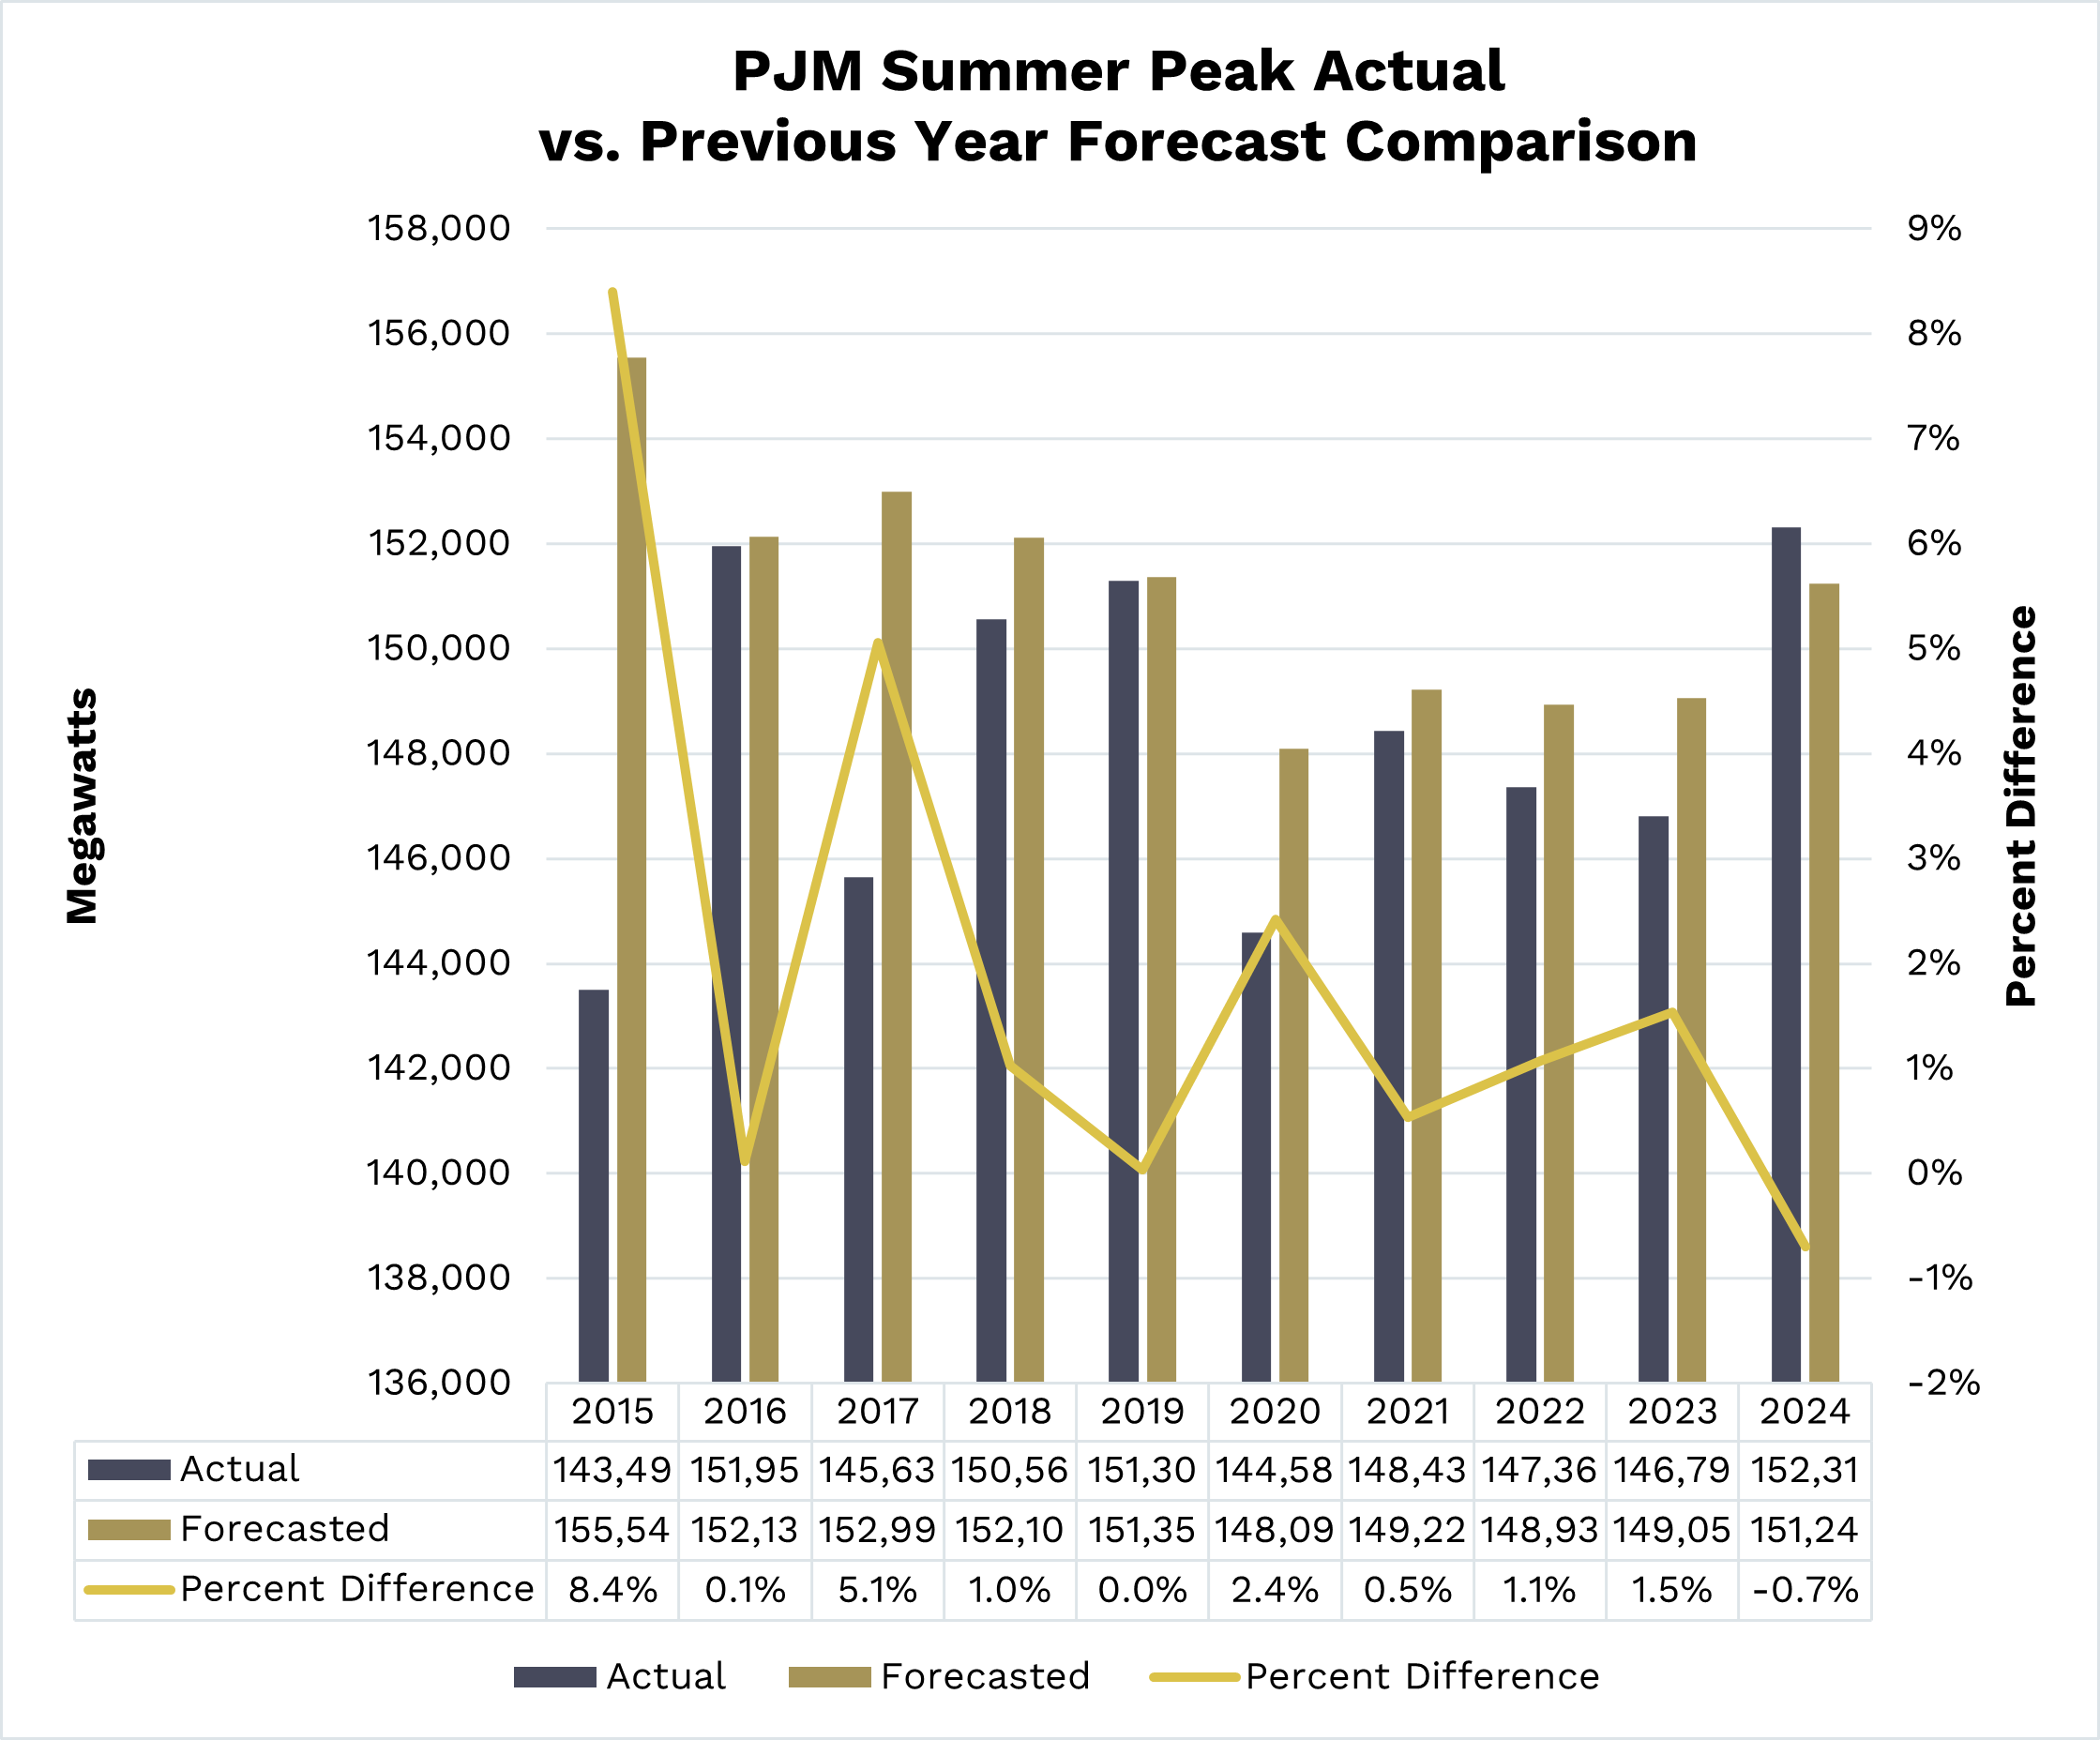
Figure 11
Figure 11
Reflecting this importance, PJM’s next-year peak forecast has averaged a 2.1% difference, with its accuracy improving steadily since 2015, as shown in Figure 11. Notably, PJM’s 2024 summer peak forecast was lower than the actual peak, departing from prior trends and indicating that resource adequacy planning studies may have underestimated the need for new resources in that planning year.

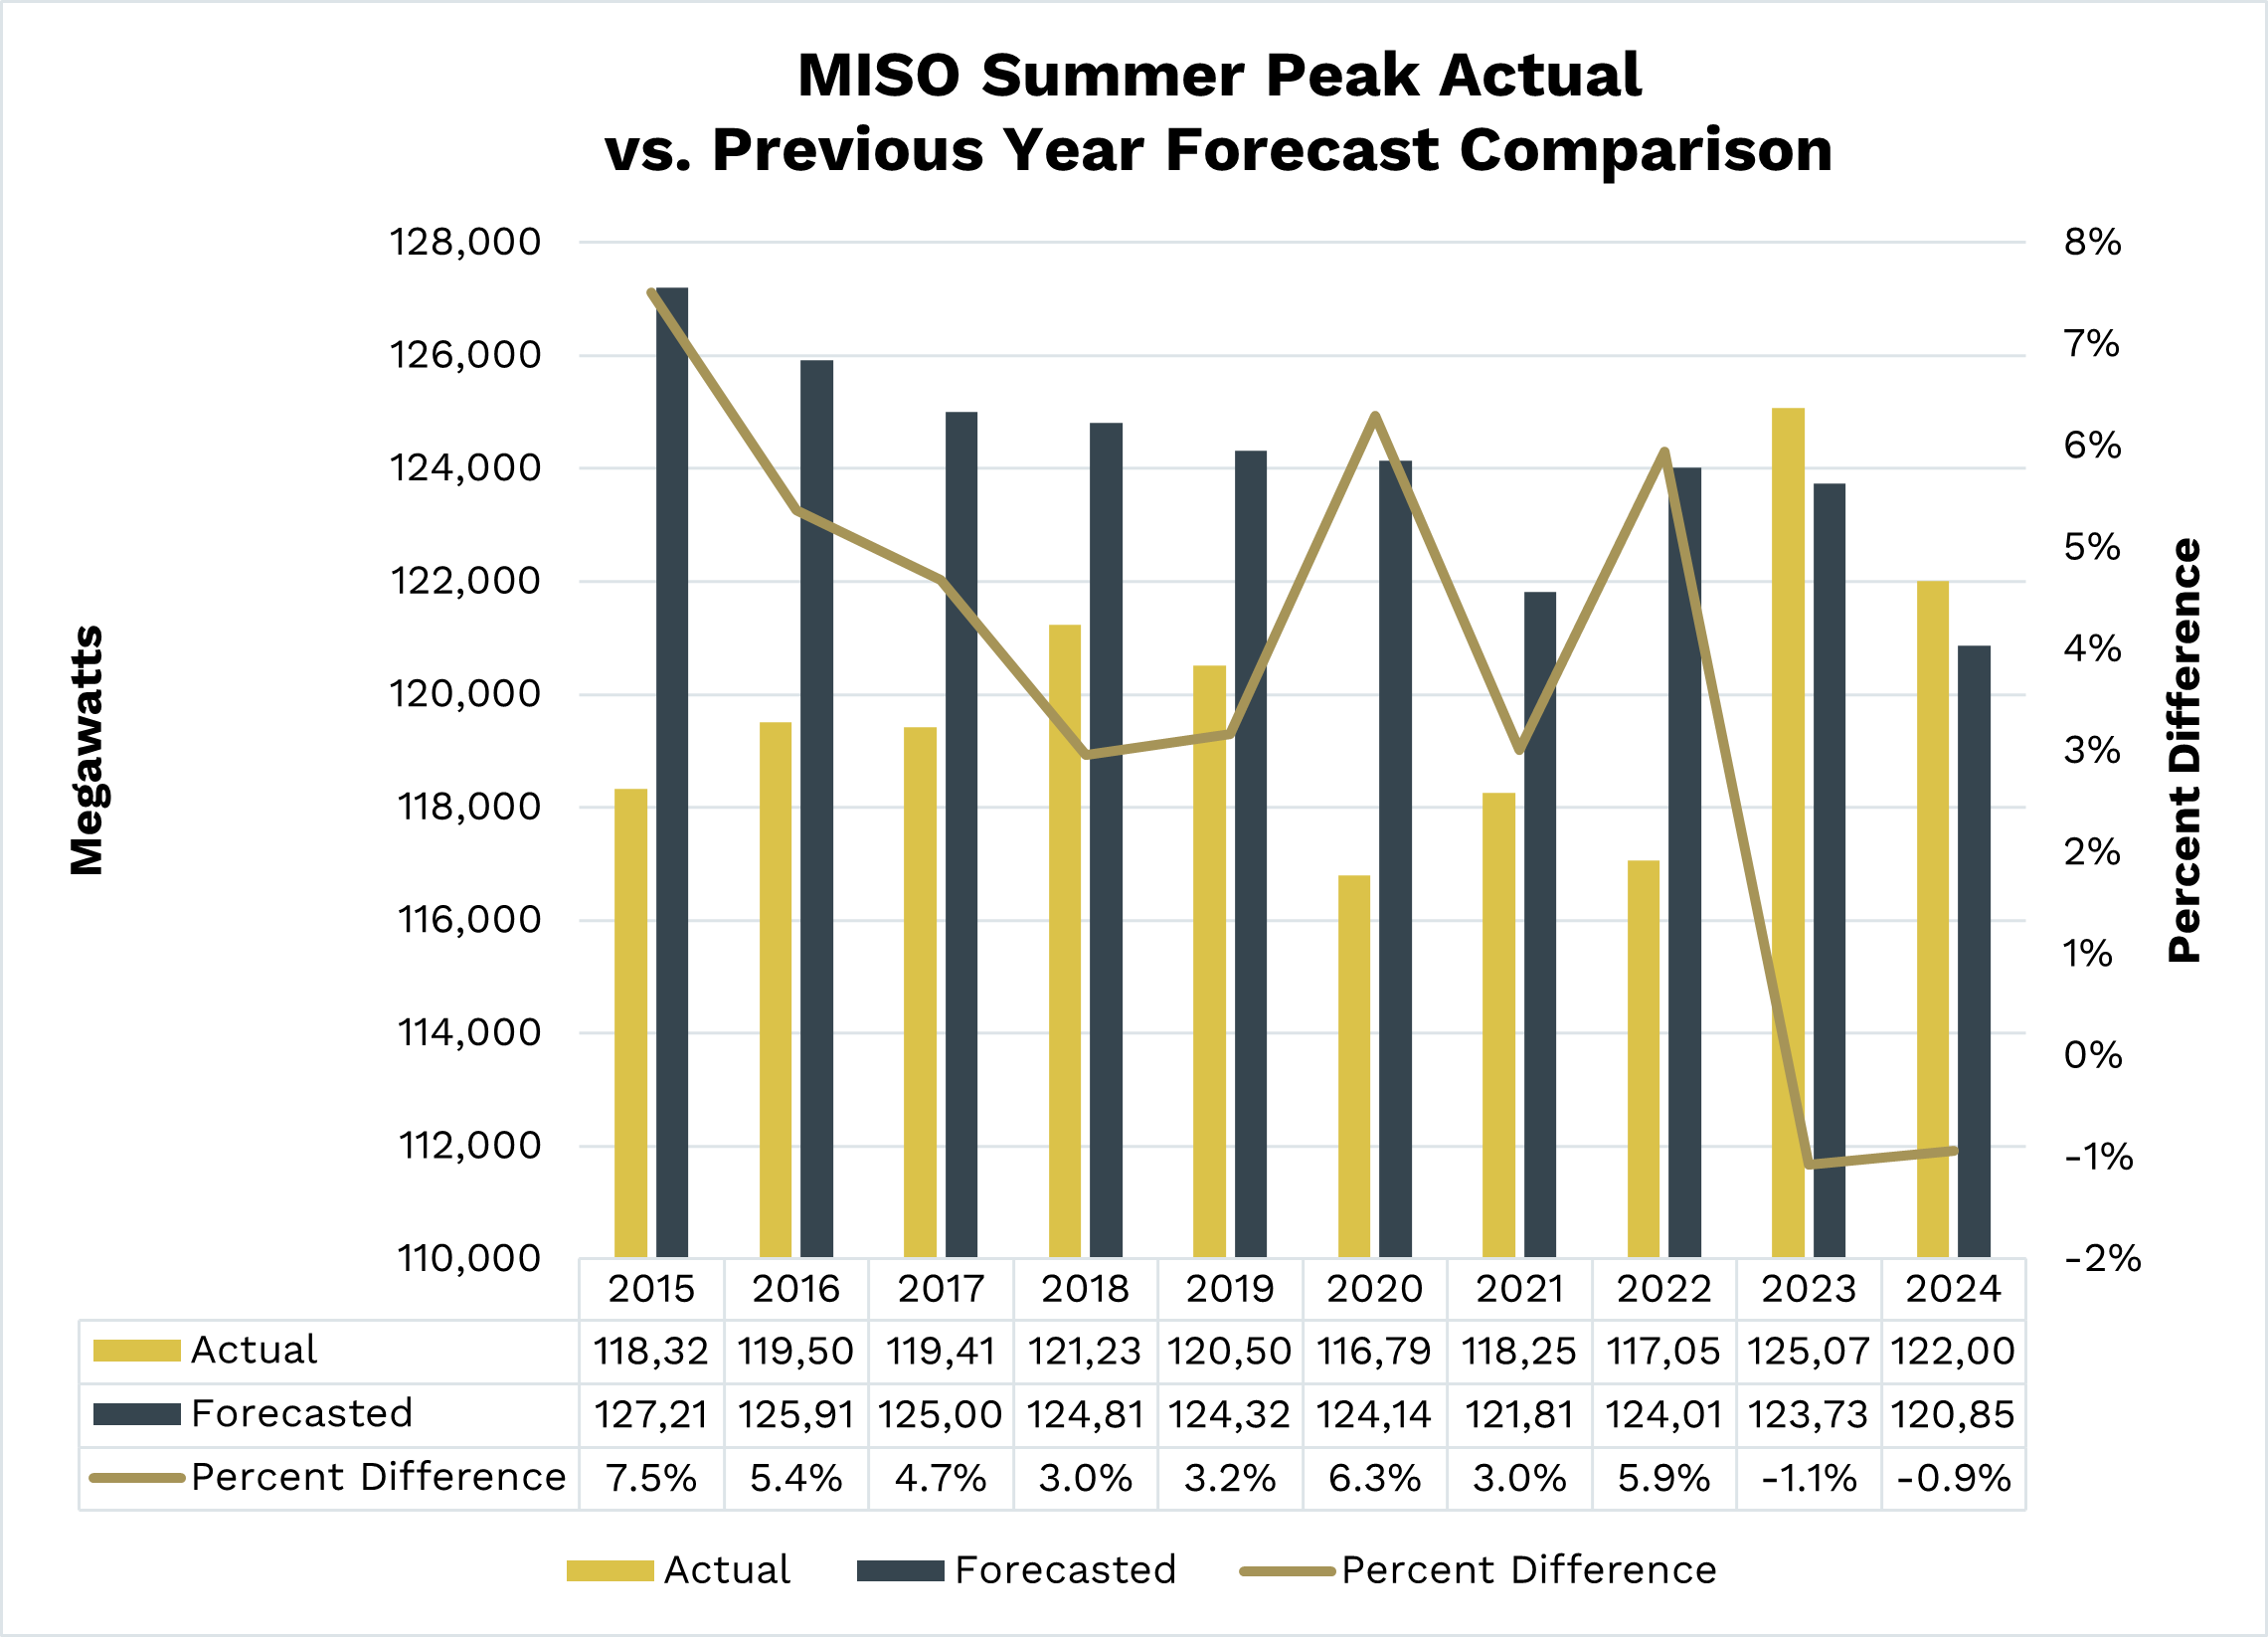
Figure 12
Figure 12
For summer peak, MISO had an average forecast difference of 4.1% from 2015 to 2024 when predicting the next year’s peak. However, MISO improved its demand forecast accuracy in 2023 and 2024 (with an average of just 1% difference), as shown in Figure 12. And like PJM, MISO’s 2023 and 2024 summer peak forecasts were also lower than the actual summer peak, indicating that the resource adequacy studies during those planning years may have underestimated the need for new resource development.

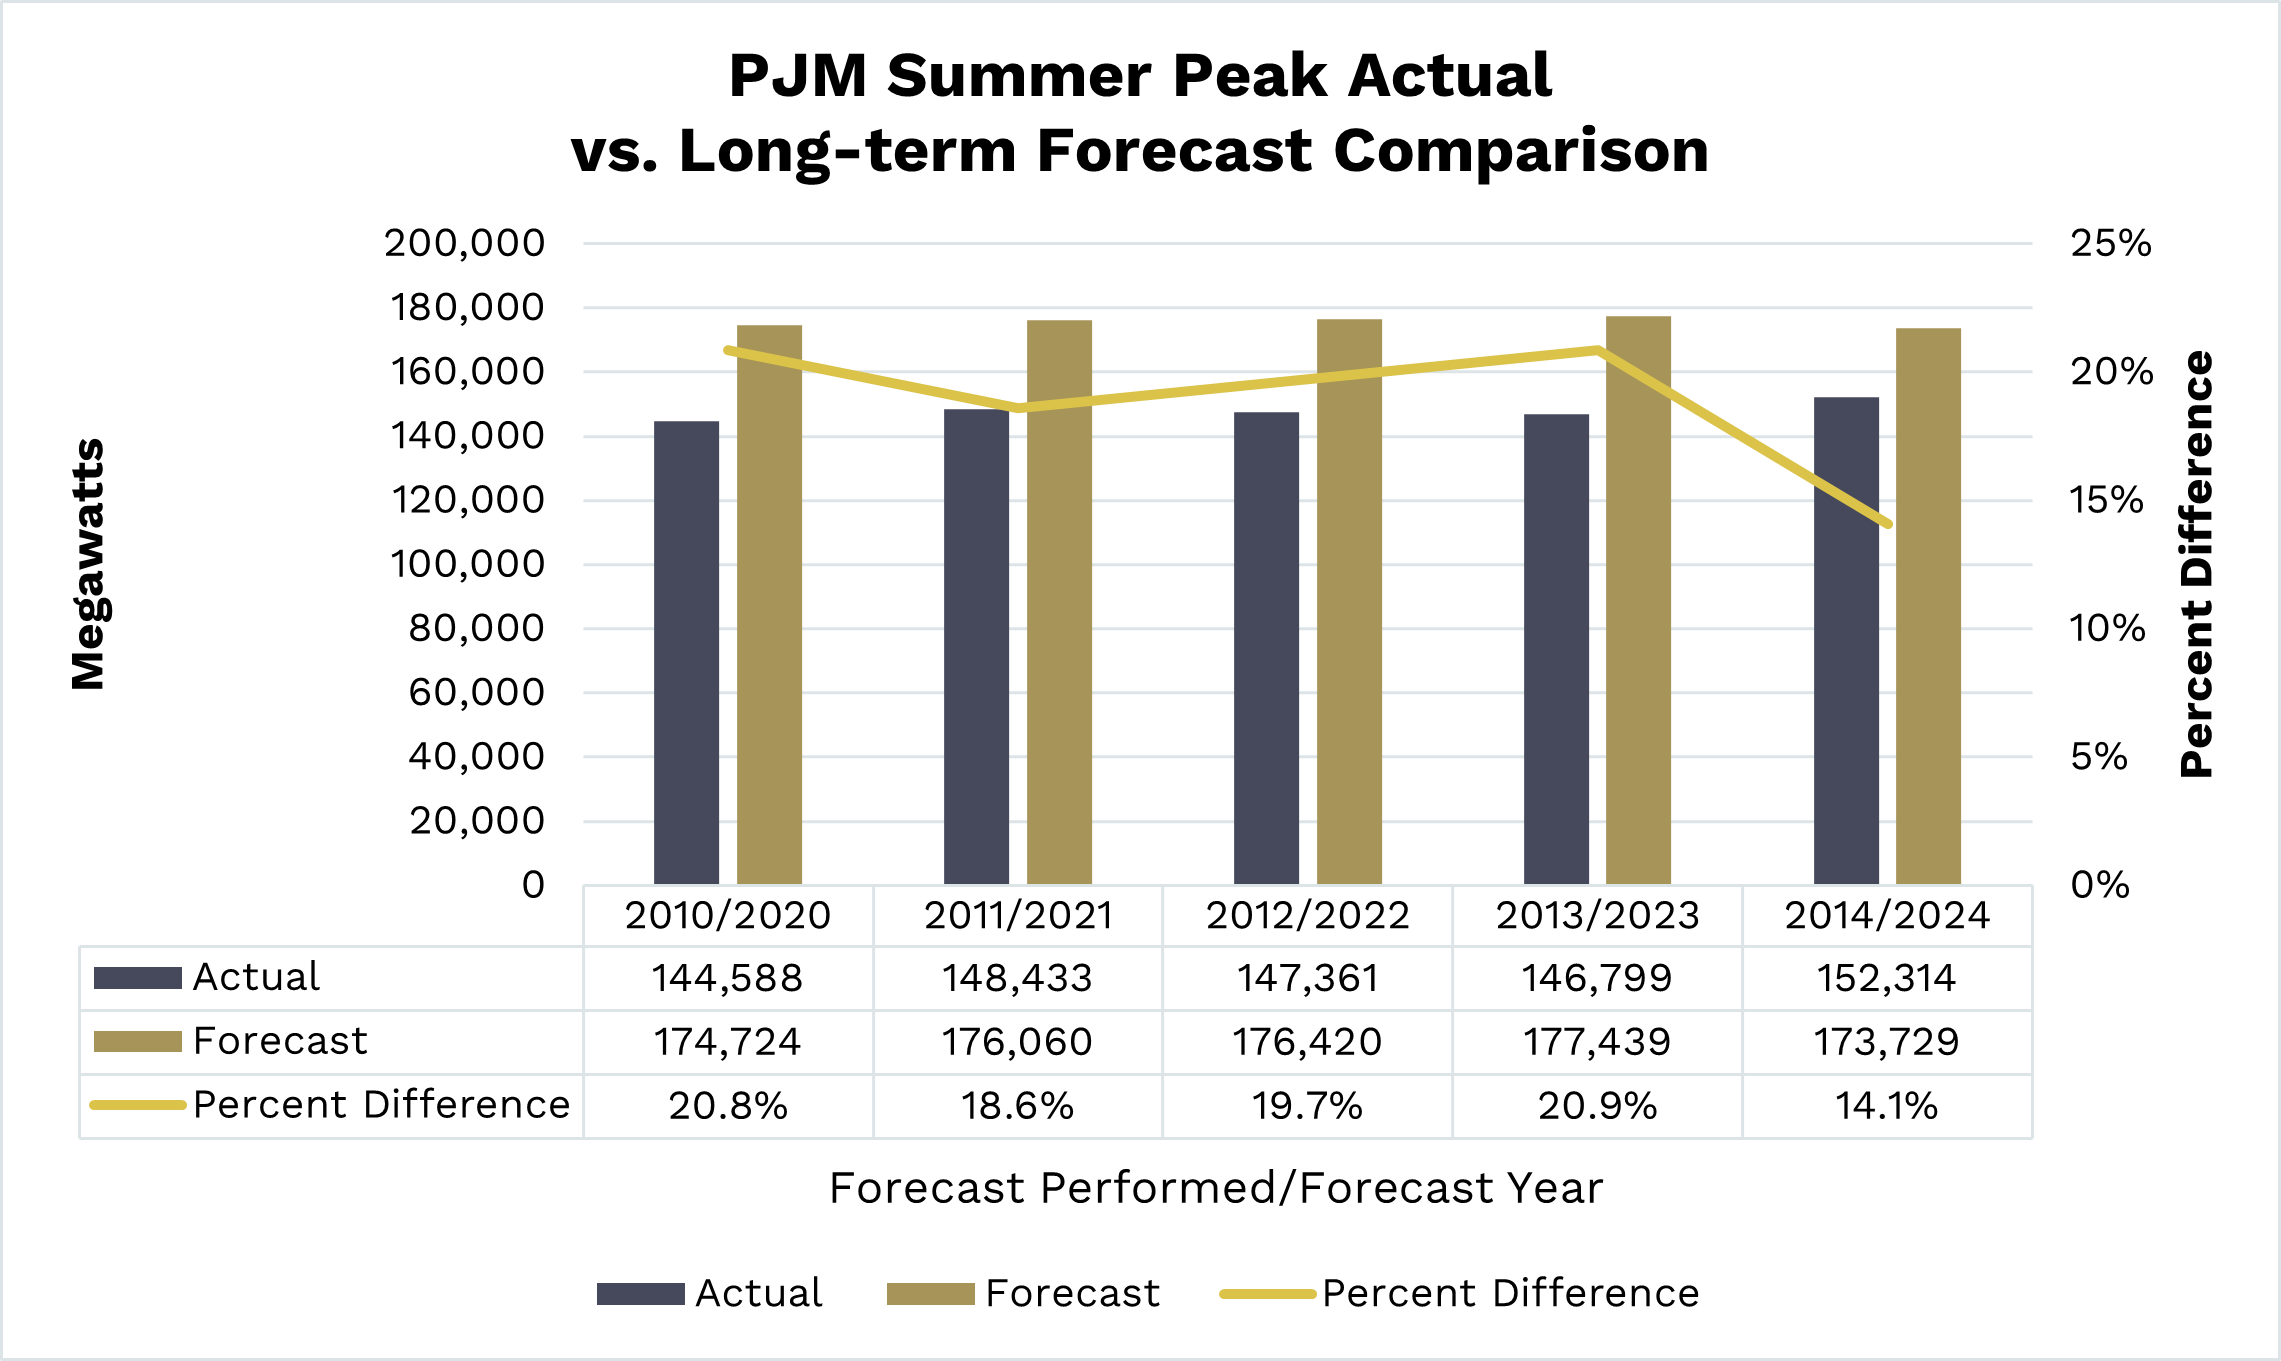
Figure 13
Figure 13
While PJM and MISO’s next-year summer peak forecasts are highly accurate, long-term projections show greater uncertainty, however this is typical for forecasts 10 years and greater into the future. PJM’s long-term forecasts have consistently overestimated summer peak demand, averaging a 19% difference (equivalent to about 28 GW above actual demand), as shown in Figure 13. Many factors over a 10-year period can affect these forecasts, such as consumer markets, new technology, policies and a changing economic landscape, and even a small percent deviation on a year-to-year basis mathematically compounds as projection into the future increases.

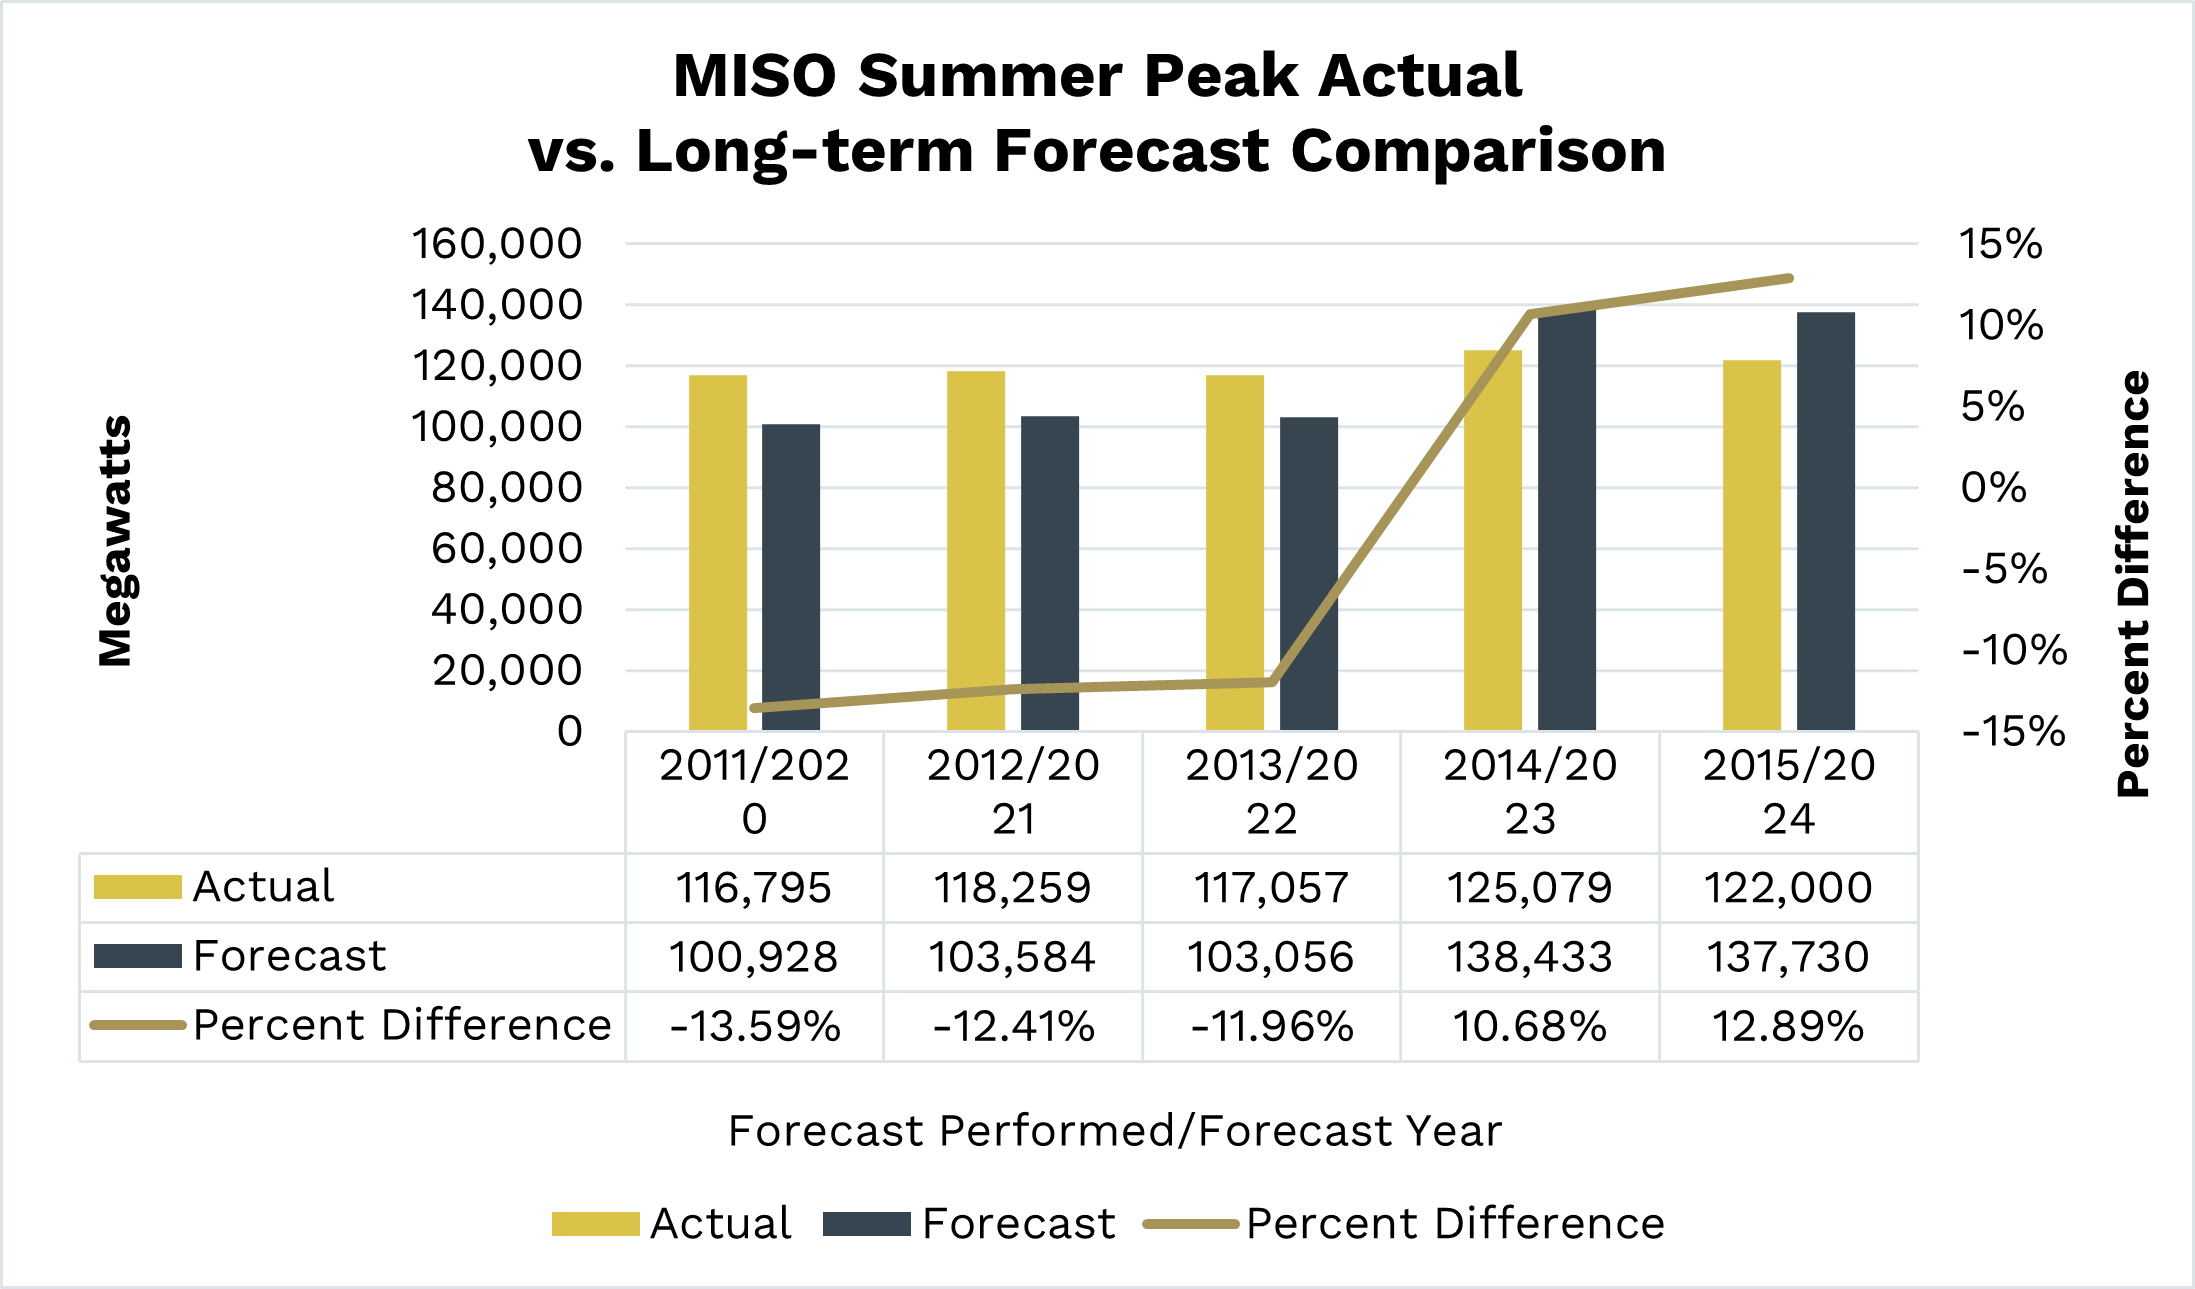
Figure 14
Figure 14
Similarly, MISO’s long-term forecasts have a 12% difference, equivalent to roughly 15 GW above actual demand, as shown in Figure 14.
Key takeaways
Both PJM and MISO are experiencing notable growth in electricity demand, driven primarily by the expansion of data centers, alongside advancements in electrification, and increased manufacturing activity.
Forecasts show a steady rise in demand projections, reflecting the evolving energy landscape and the impact of new technologies and industries.
ReliabilityFirst continues to closely monitor long-term load forecasts to identify where demand may begin to outpace available resources.
Forecast accuracy for upcoming years has generally improved, though there are ongoing challenges in predicting long-term demand due to rapid growth and increasing complexity.
Both PJM and MISO have encountered recent scenarios where actual demand exceeded forecasted values, highlighting the importance of continued refinement and vigilance in forecasting methods.

Resource growth
Resource changes
The bulk power system in the ReliabilityFirst footprint is undergoing a major transformation. Traditionally fueled by coal and natural gas resources, the grid is now integrating inverter-based resources (IBRs) powered by solar, wind, and various energy storage technologies. This shift, driven by clean energy goals and emerging technologies, introduces new complexities for system operators.
Maintaining reliability while managing a more diverse and variable resource mix requires new strategies. Operators must address challenges like resource availability during extreme weather, day-night variability, and shifting demand peaks. These dynamics require deeper analysis and more adaptive planning to ensure grid stability and performance. Here are some of the larger trends and changes related to resources over the next 10 years within the ReliabilityFirst region.


Existing and planned capacity

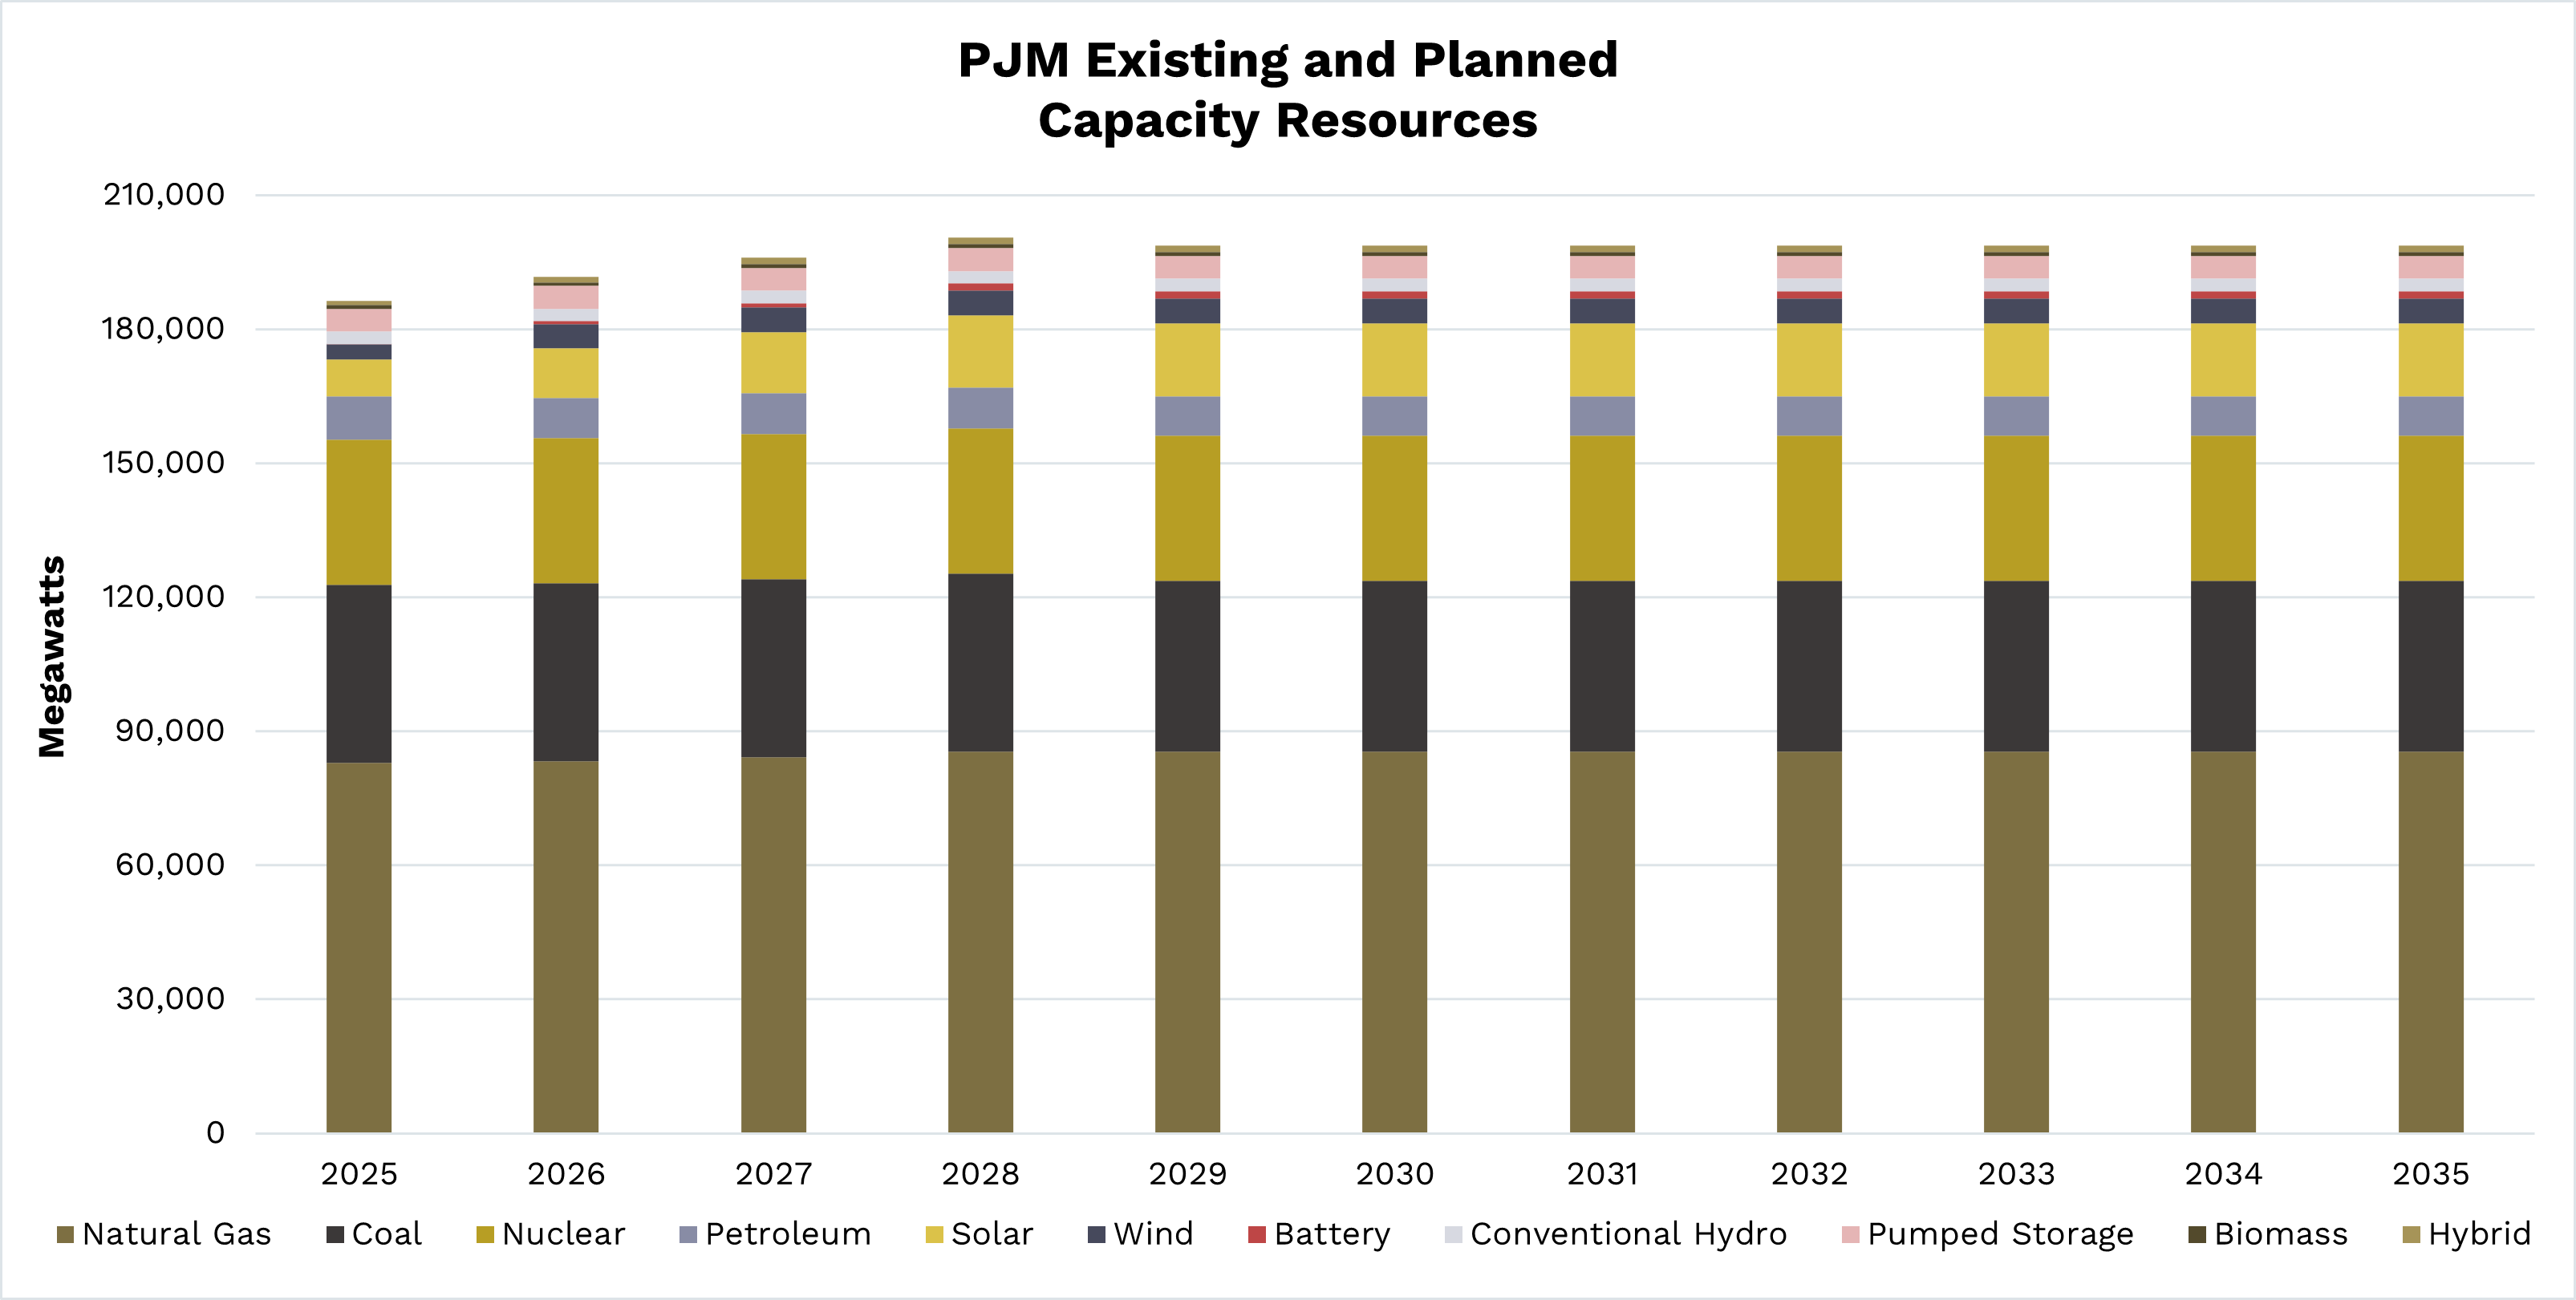
Figure 15
Figure 15
Over the next 10 years, PJM anticipates the addition of 12 GW in planned capacity to its resource capability, as shown in Figure 15. While natural gas, coal, and nuclear remain the dominant fuel sources, solar capacity is expected to increase 8 GW over the next 10 years.

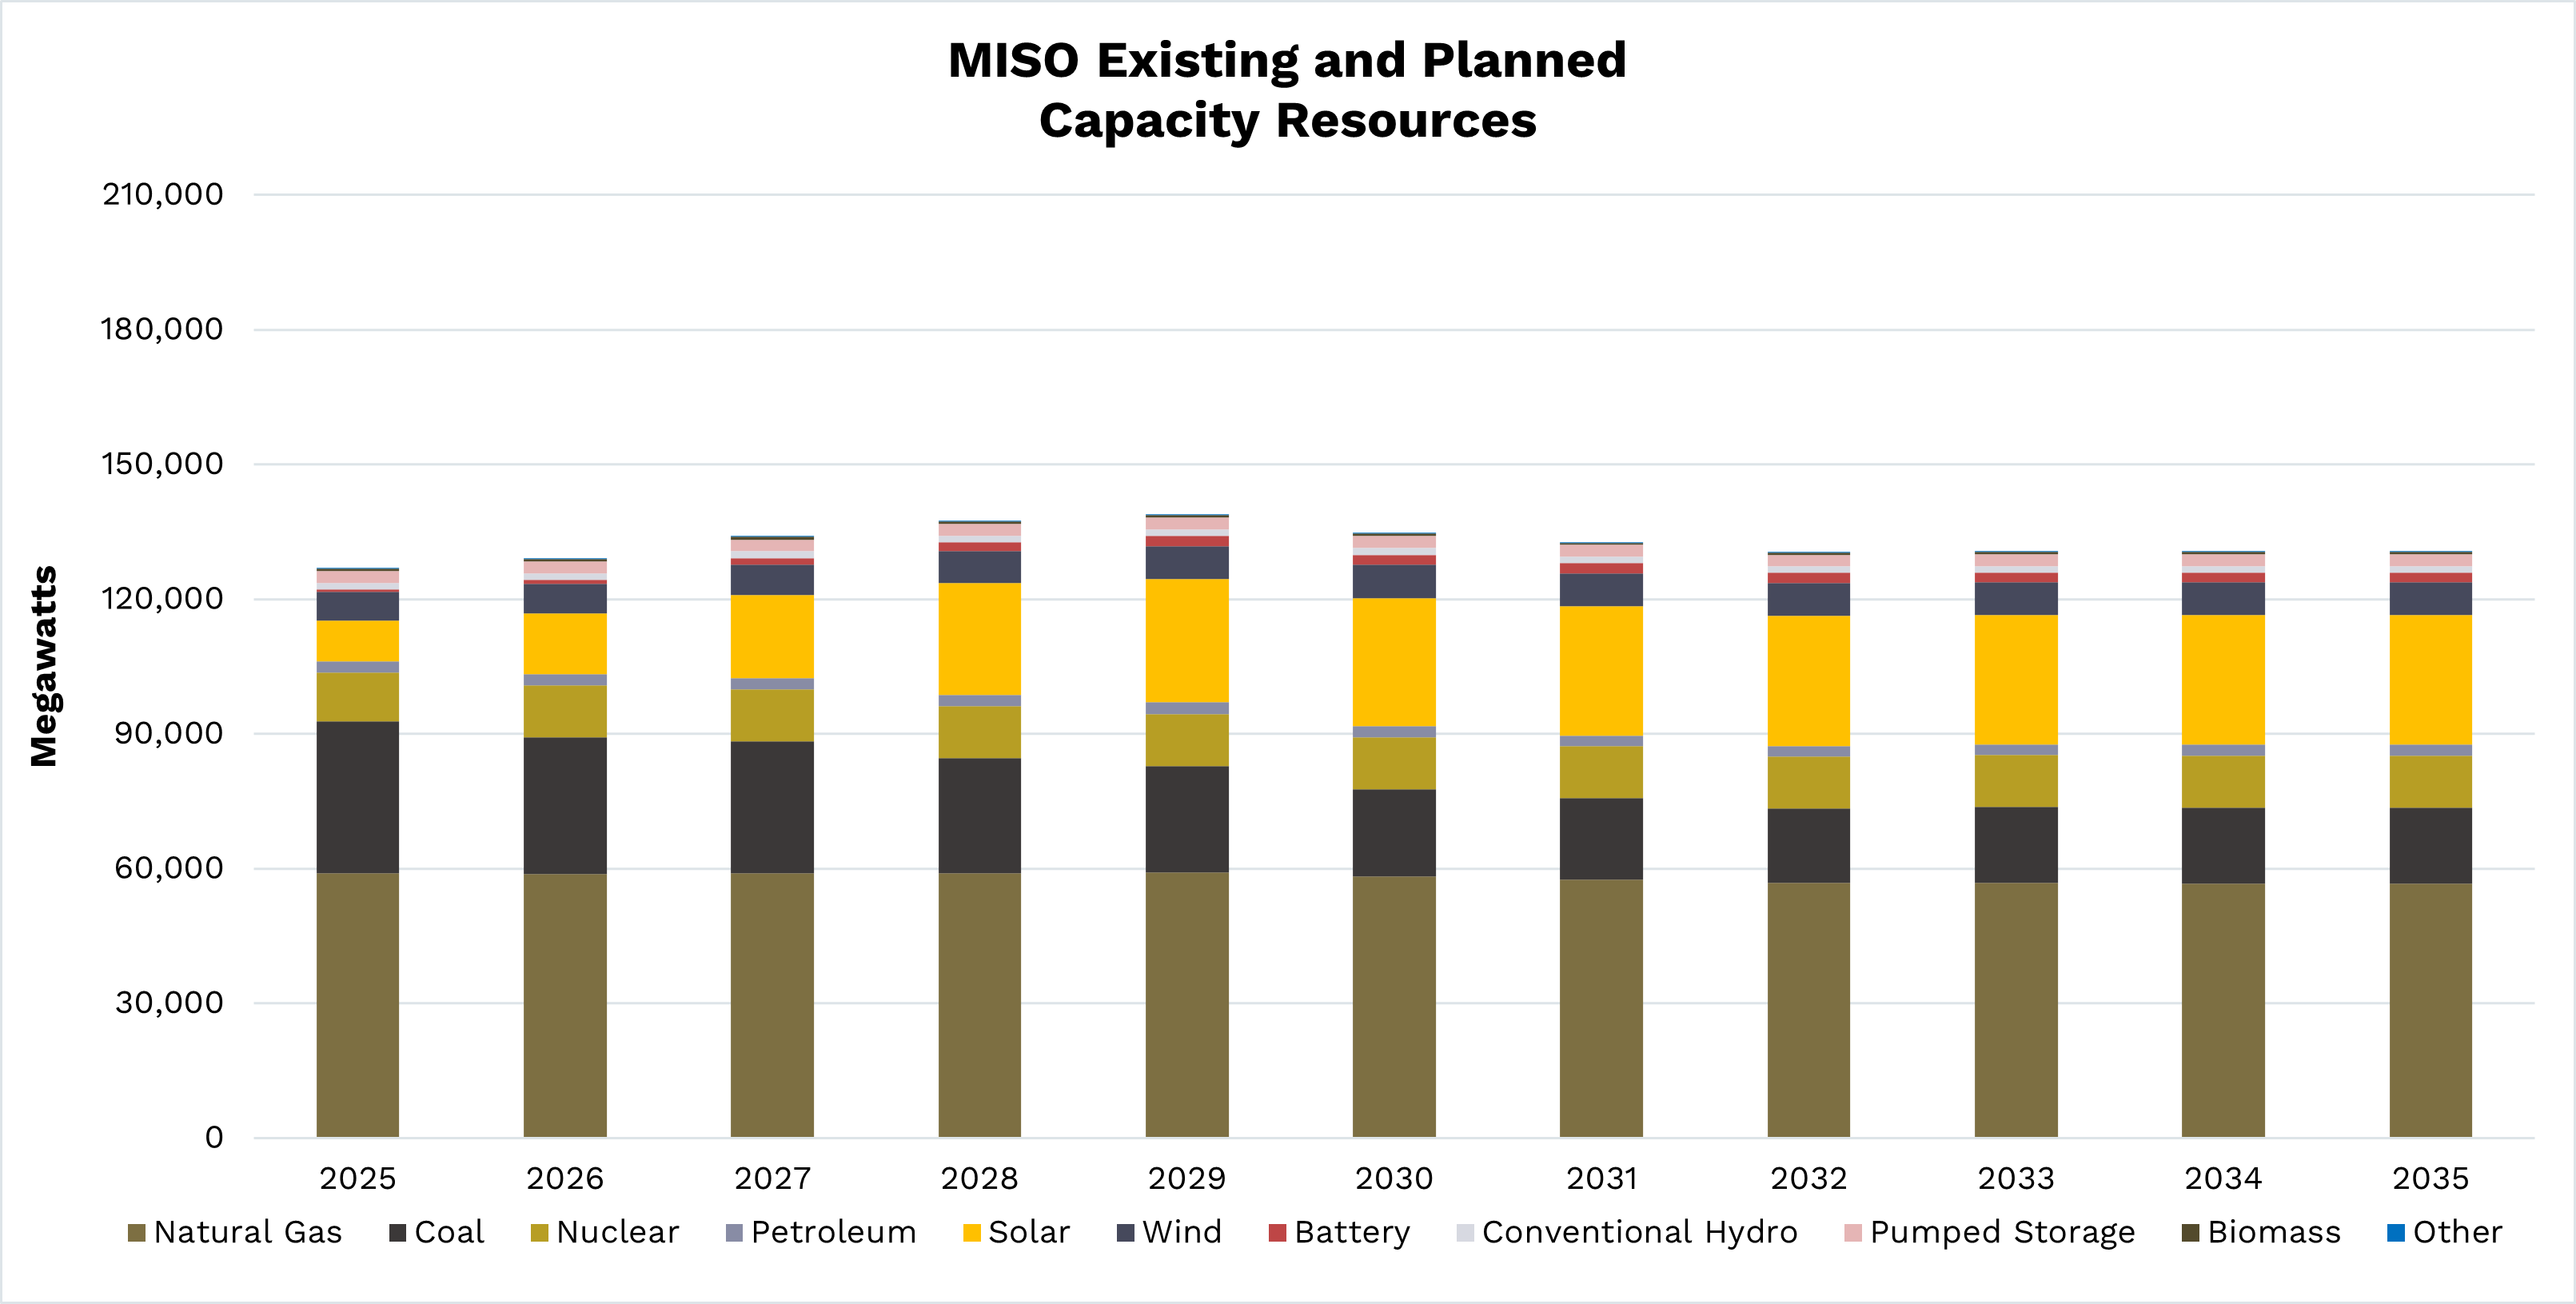
Figure 16
Figure 16
Over the next decade, MISO anticipates adding 3.6 GW of total capacity, as shown in Figure 16. Its resource portfolio is transitioning more rapidly than PJM’s, characterized by a sharper decline in coal generation and a notable expansion in solar capacity. While natural gas continues to serve as the dominant fuel source, substantial coal retirements are expected in the MISO footprint. These retirements are offset by a projected 20 GW increase in solar resources, signaling a significant shift in the MISO area’s generation mix.
Renewable resource growth

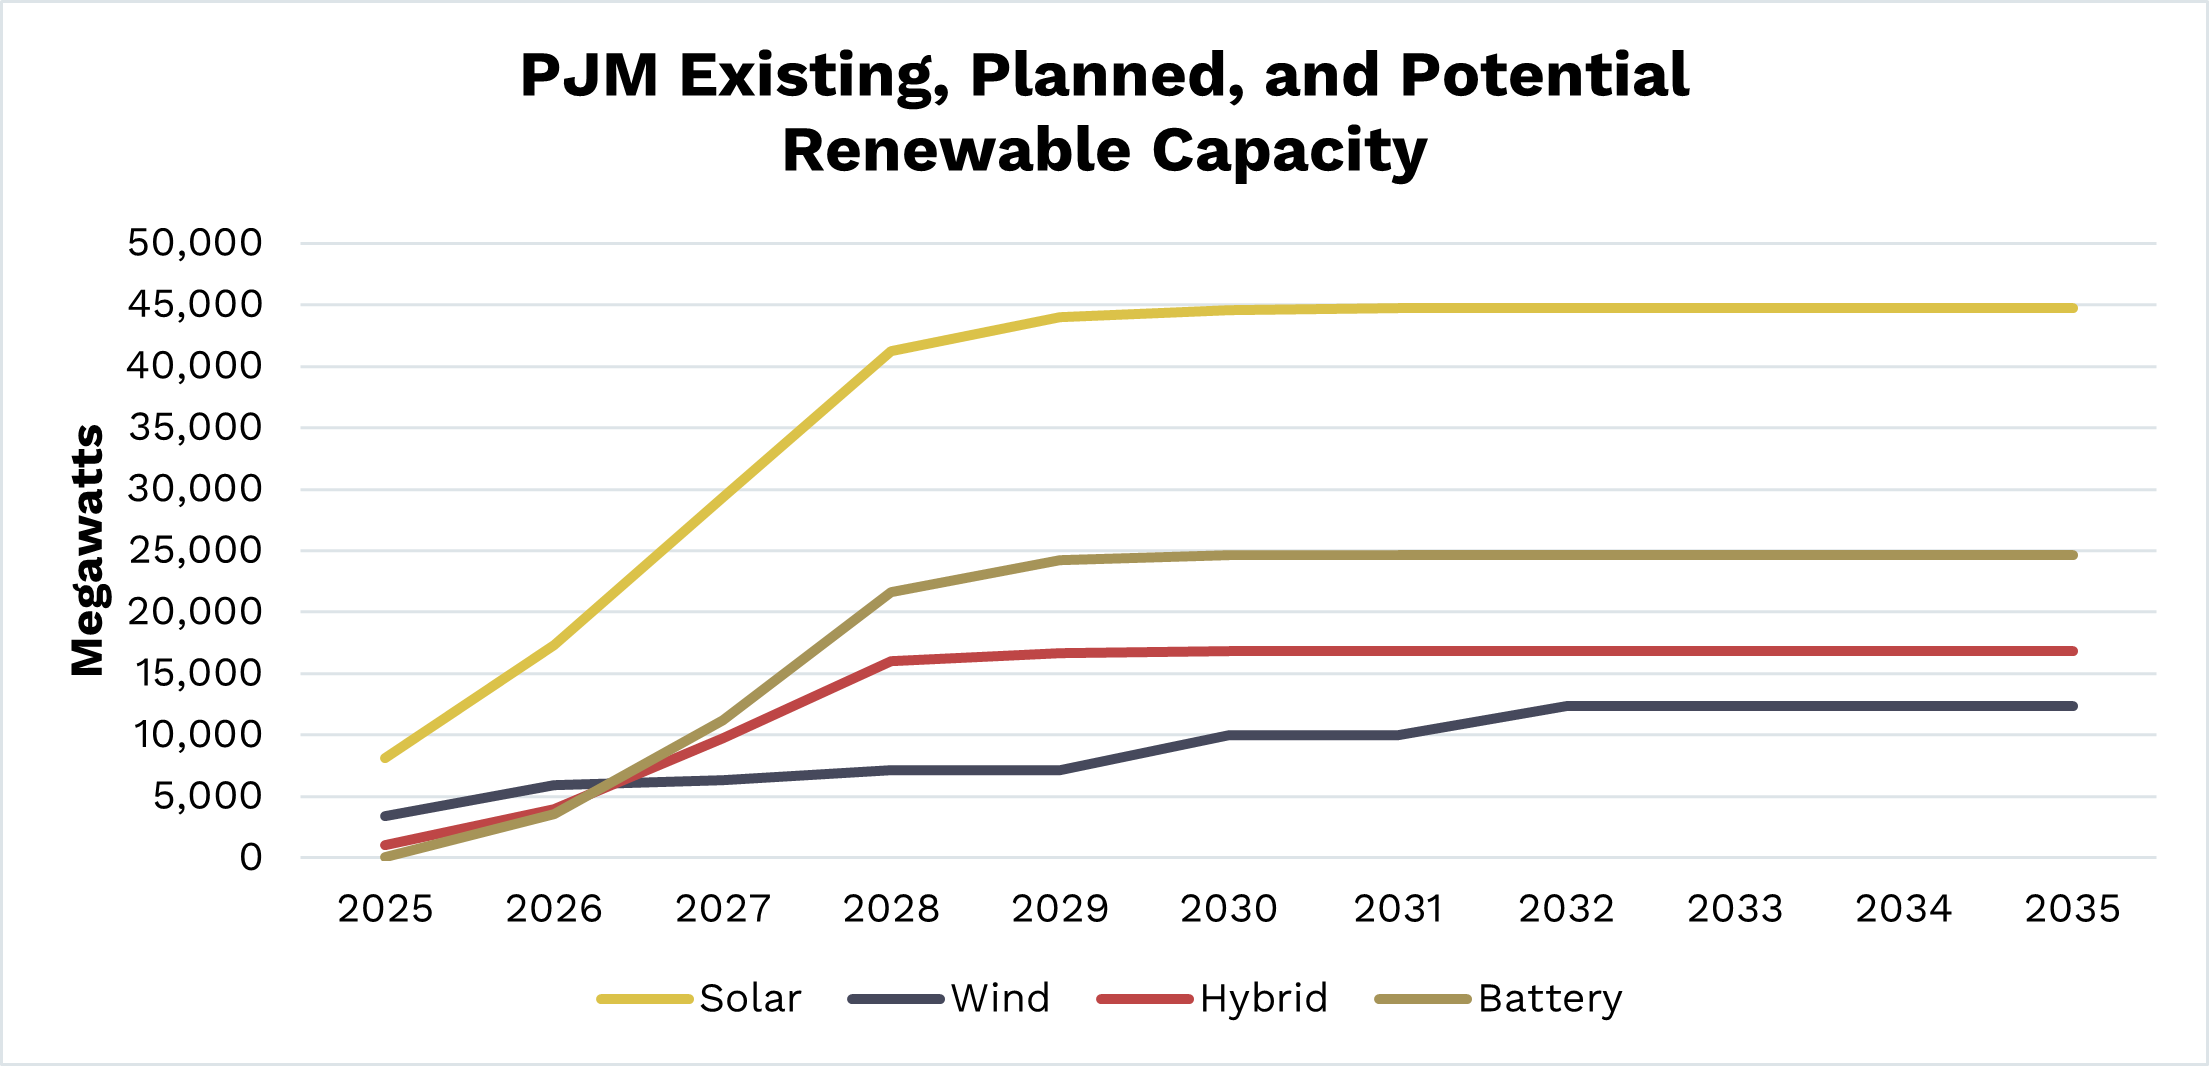
Figure 17
Figure 17
In addition to the resources that have met approved planning requirements, numerous projects remain in the queue at early study stages and are classified as potential capacity. PJM has a total of 74 GW of potential capacity resources in the queue, comprised of solar, wind, hybrid, and battery storage. Although many of these projects may not materialize, widespread interconnection with many of these resources coming online could substantially increase the overall resource capacity. Solar resources have the most growth potential, with 28 GW of capacity beyond existing and planned additions. Battery and hybrid resources also have the potential for significant growth with 23 GW and 15 GW, respectively.
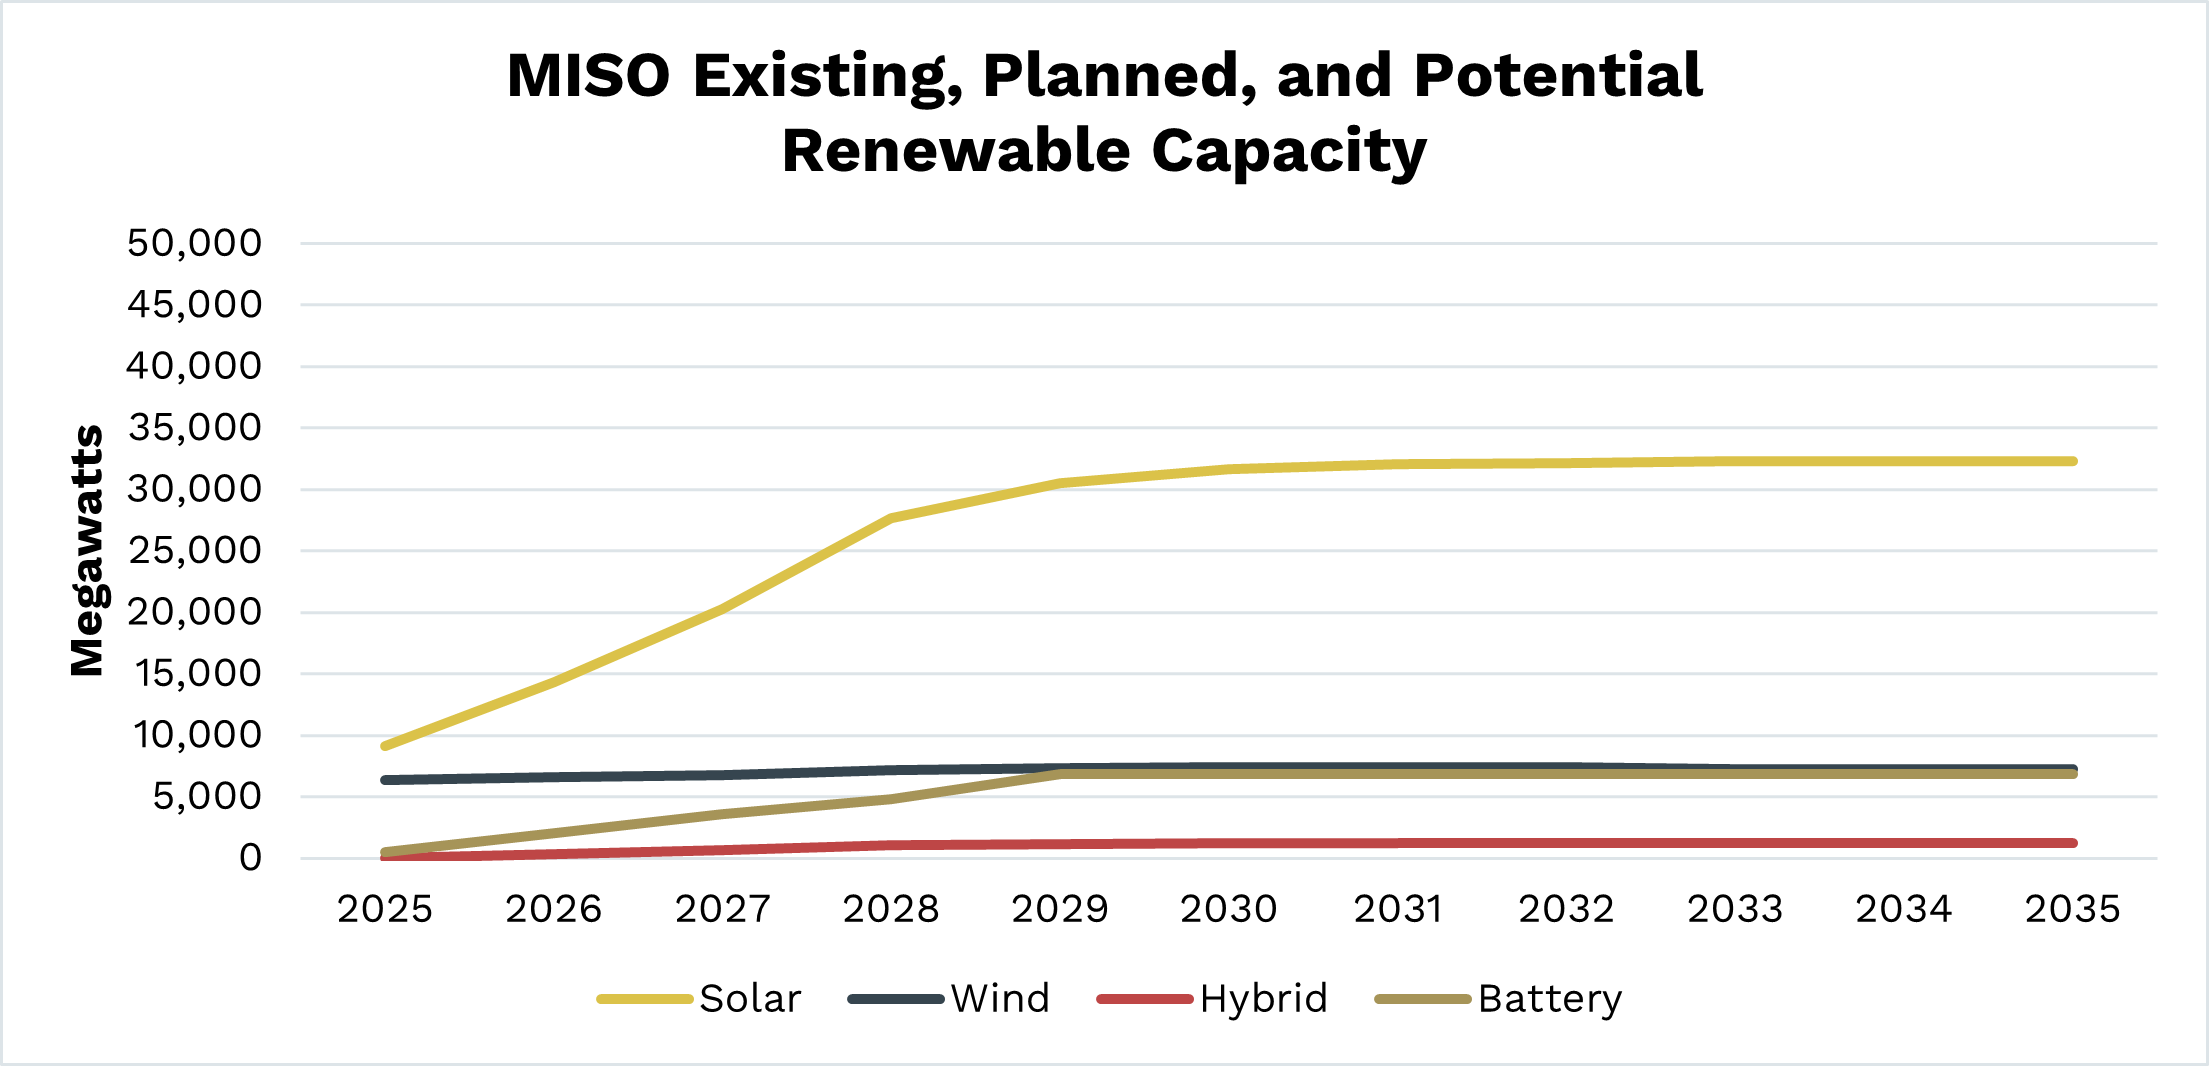
Figure 18
Figure 18
Compared to PJM, MISO has a larger portfolio of existing and planned renewable resources, including 29 GW of solar and 7 GW of wind capacity targeted for an in-service date of 2035. Over the next decade, MISO could add an additional 9 to 22 GW of solar, wind, hybrid, and battery resources in potential capacity in its queue.
Retirements
ReliabilityFirst evaluates the net change in capacity year-over-year for both PJM and MISO by anticipating the confirmed generator retirements and the capacity in the queue that is likely to materialize on the system. This method not only accounts for retirements but also includes additions by resource type.

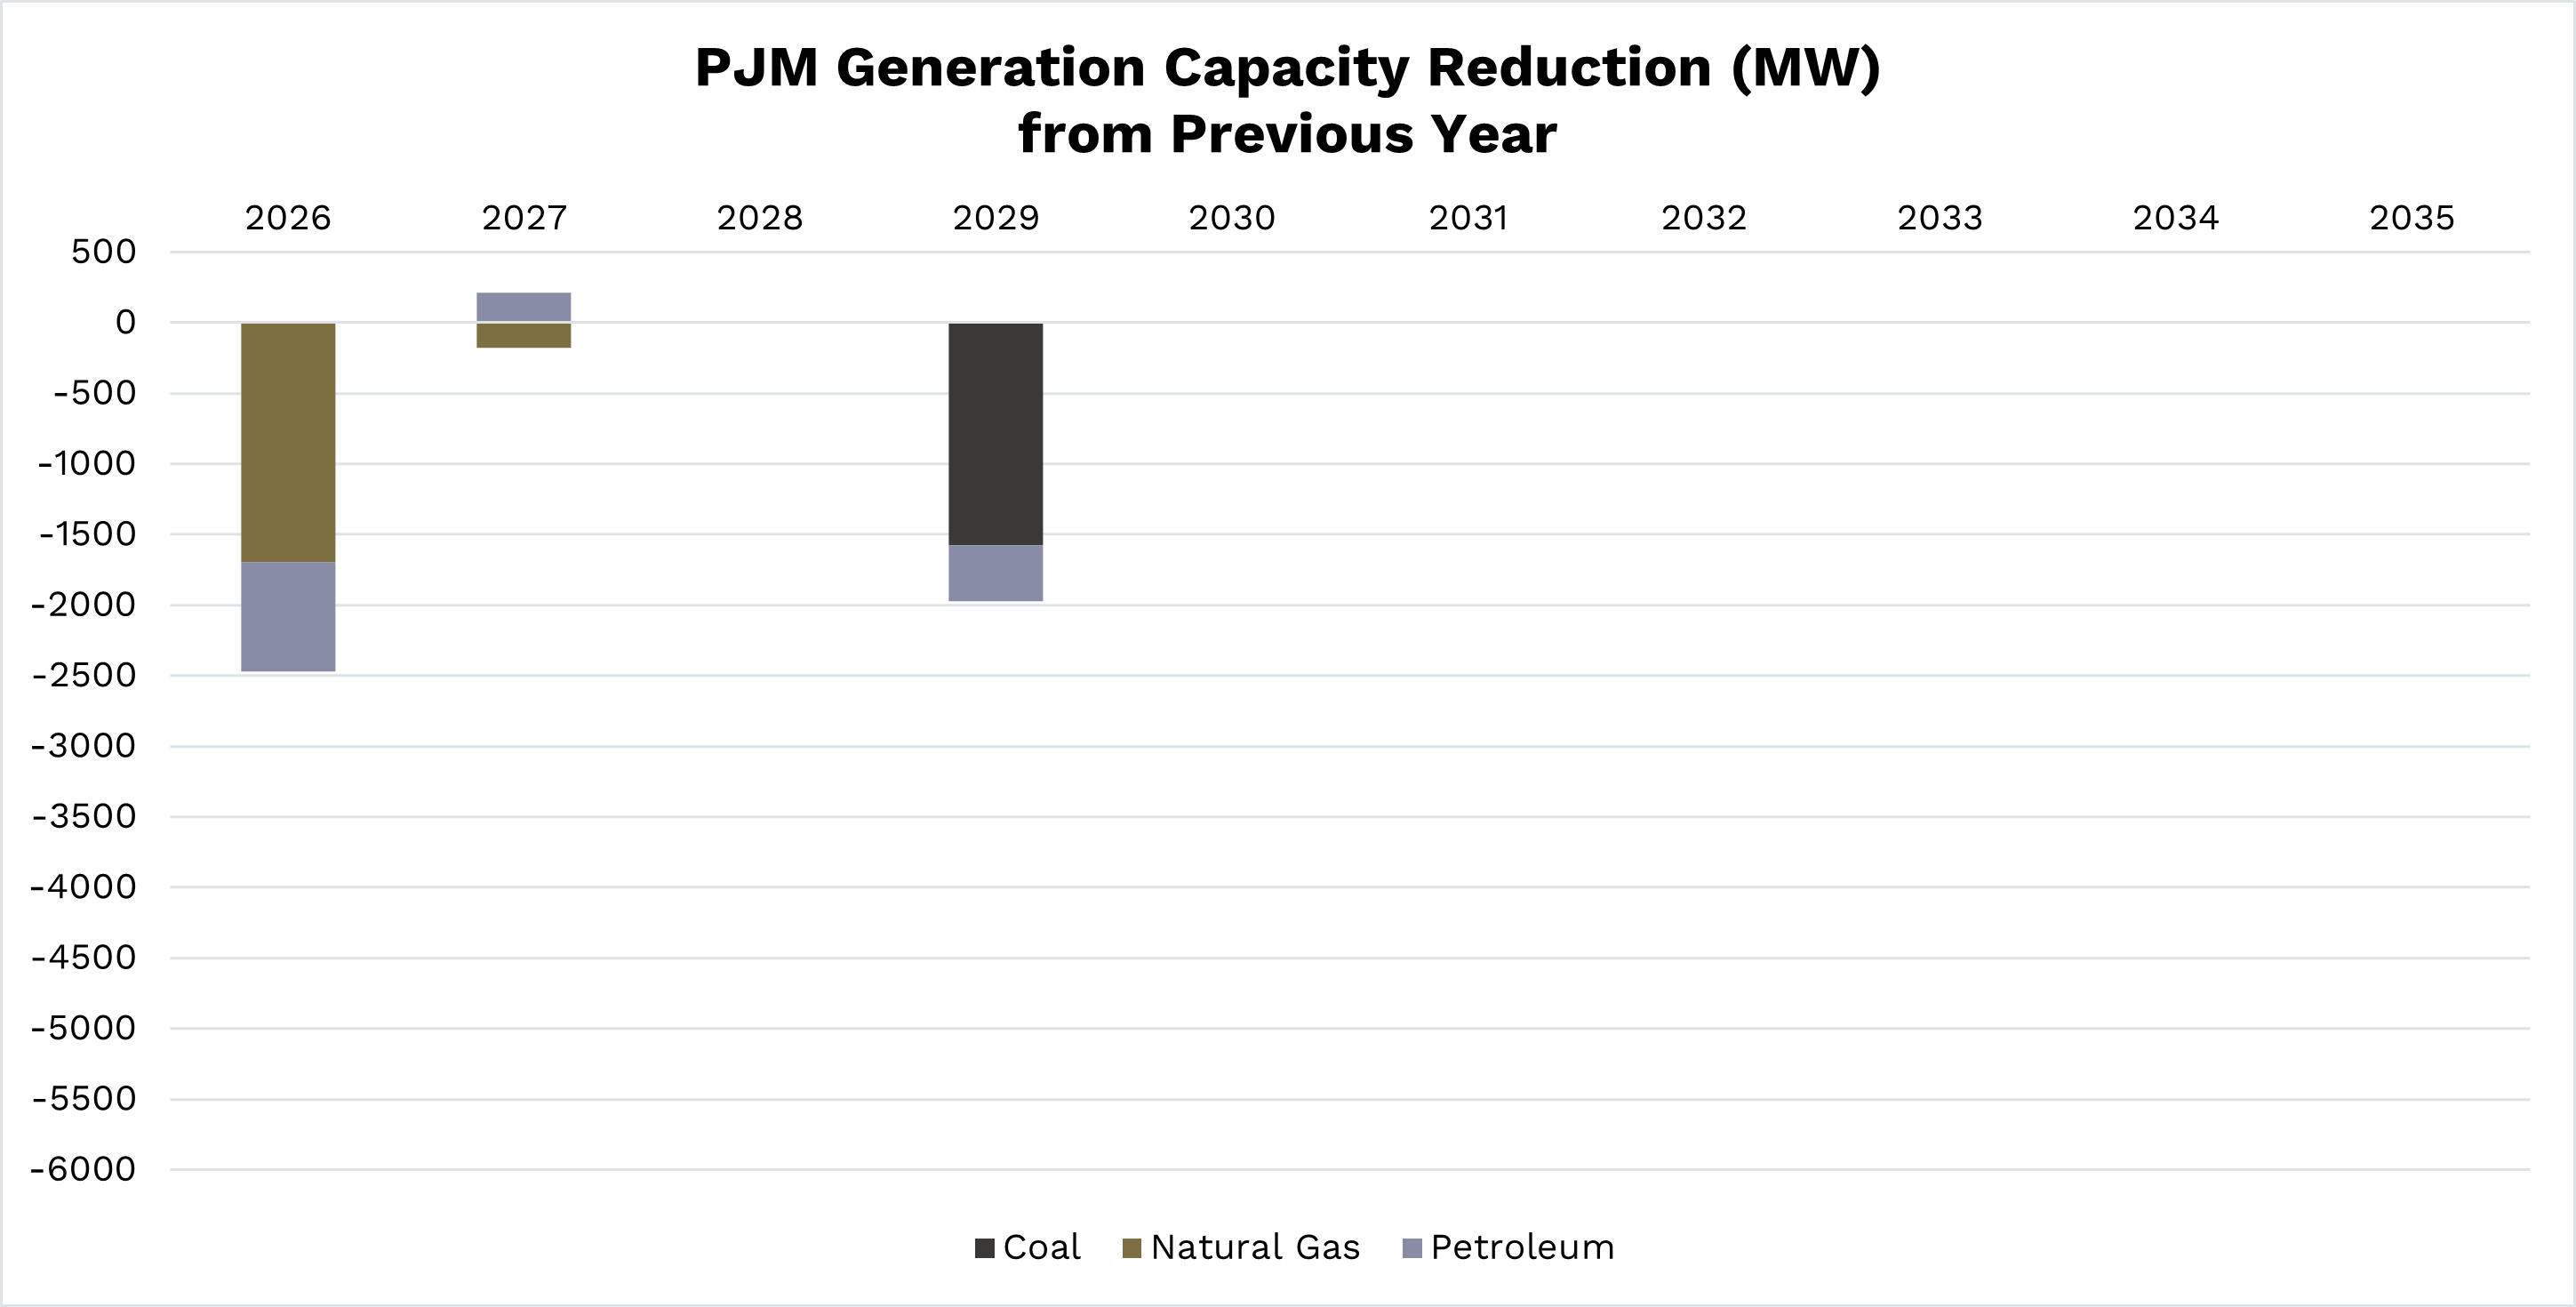
Figure 19
Figure 19
Between 2026 and 2035, PJM expects a net capacity reduction in coal, natural gas, and petroleum of 4 GW. While Figure 19 analyzes confirmed retirements, PJM has reported the potential of 41 GW of unconfirmed retirements.

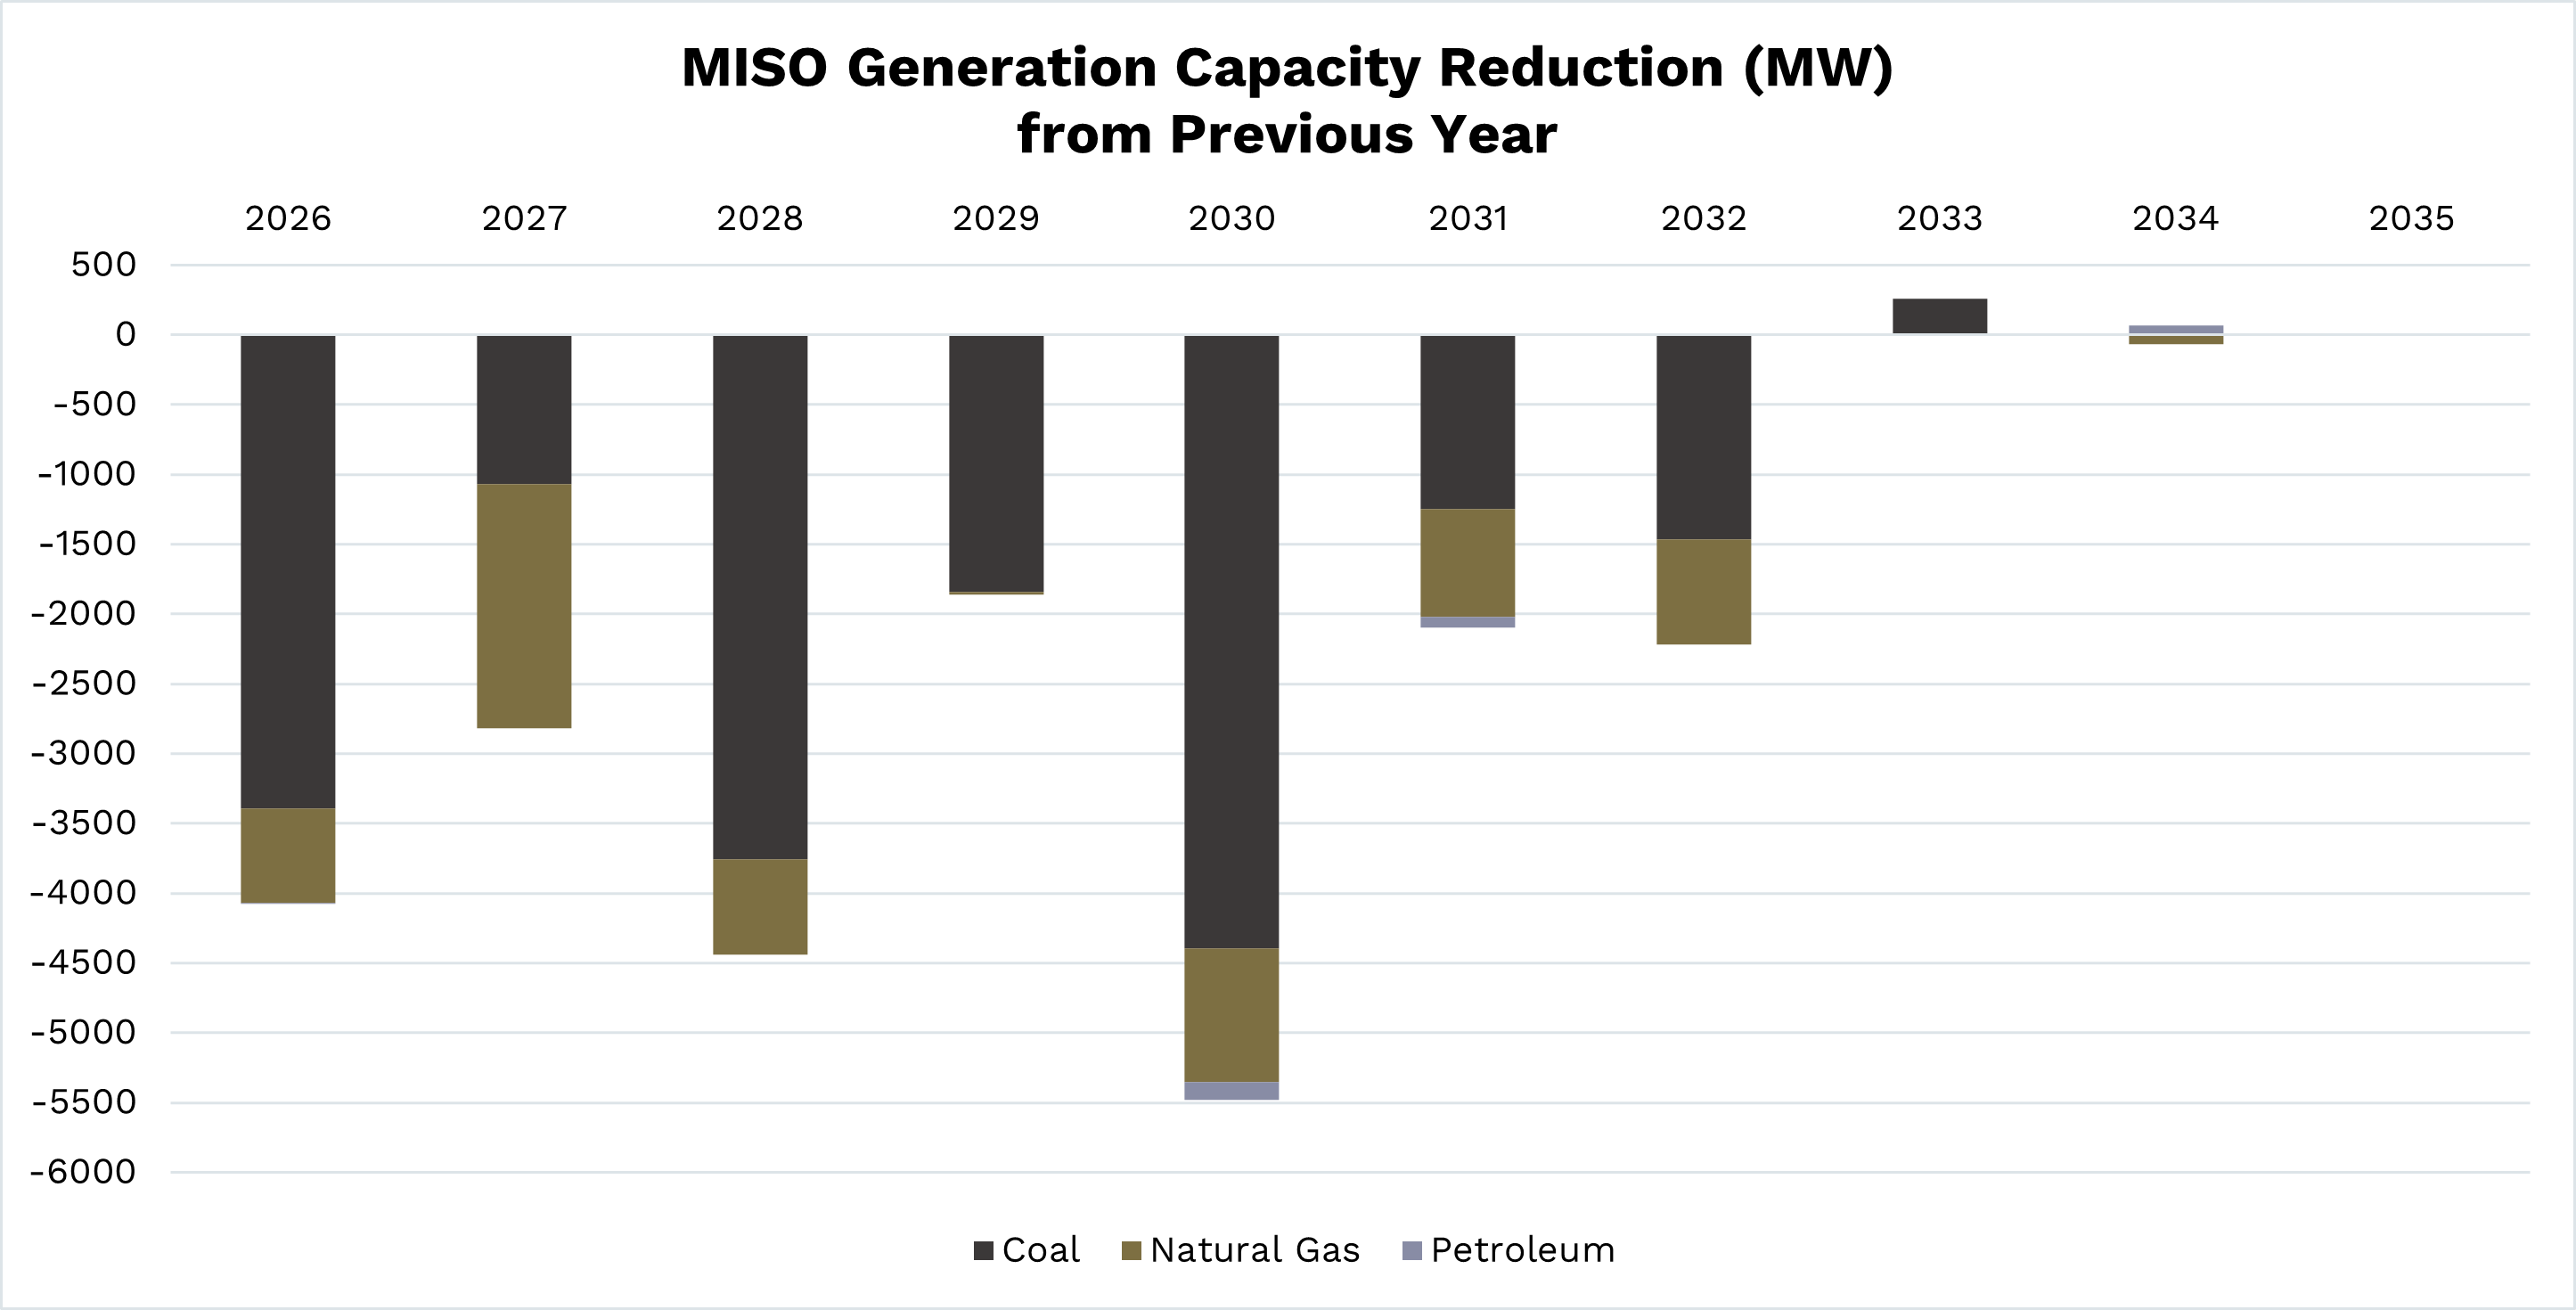
Figure 20
Figure 20
Between 2026 and 2035, MISO anticipates a net capacity reduction in coal, natural gas, and petroleum of 23 GW. The largest contributor to the year-over-year net capacity reduction is coal with a 17 GW reduction over the next nine years.
Renewable resource variability
The electric grid we depend on for continuous and reliable power is increasingly dependent on weather sensitive resources and just-in-time fuel delivery. Historically, resource adequacy has been measured by whether installed capacity could meet peak demand, relying on deterministic planning and reserve margin metrics. Today, that approach alone falls short, as there is often a gap between nameplate capacity and actual available capacity, especially under stressed system conditions. Therefore, more granular, performance-based measures are essential for planning and operations.
Both PJM and MISO report large amounts of nameplate capacity, but the share of that capacity that is truly available during critical periods can vary widely. To address this, PJM employs an Effective Load Carrying Capability (ELCC) methodology for generation units, reflecting performance expectations under stressed conditions. MISO, by contrast, uses a combination of accredited capacity values and seasonal adjustments that often result in lower availability as compared to nameplate capacity for generation resources.

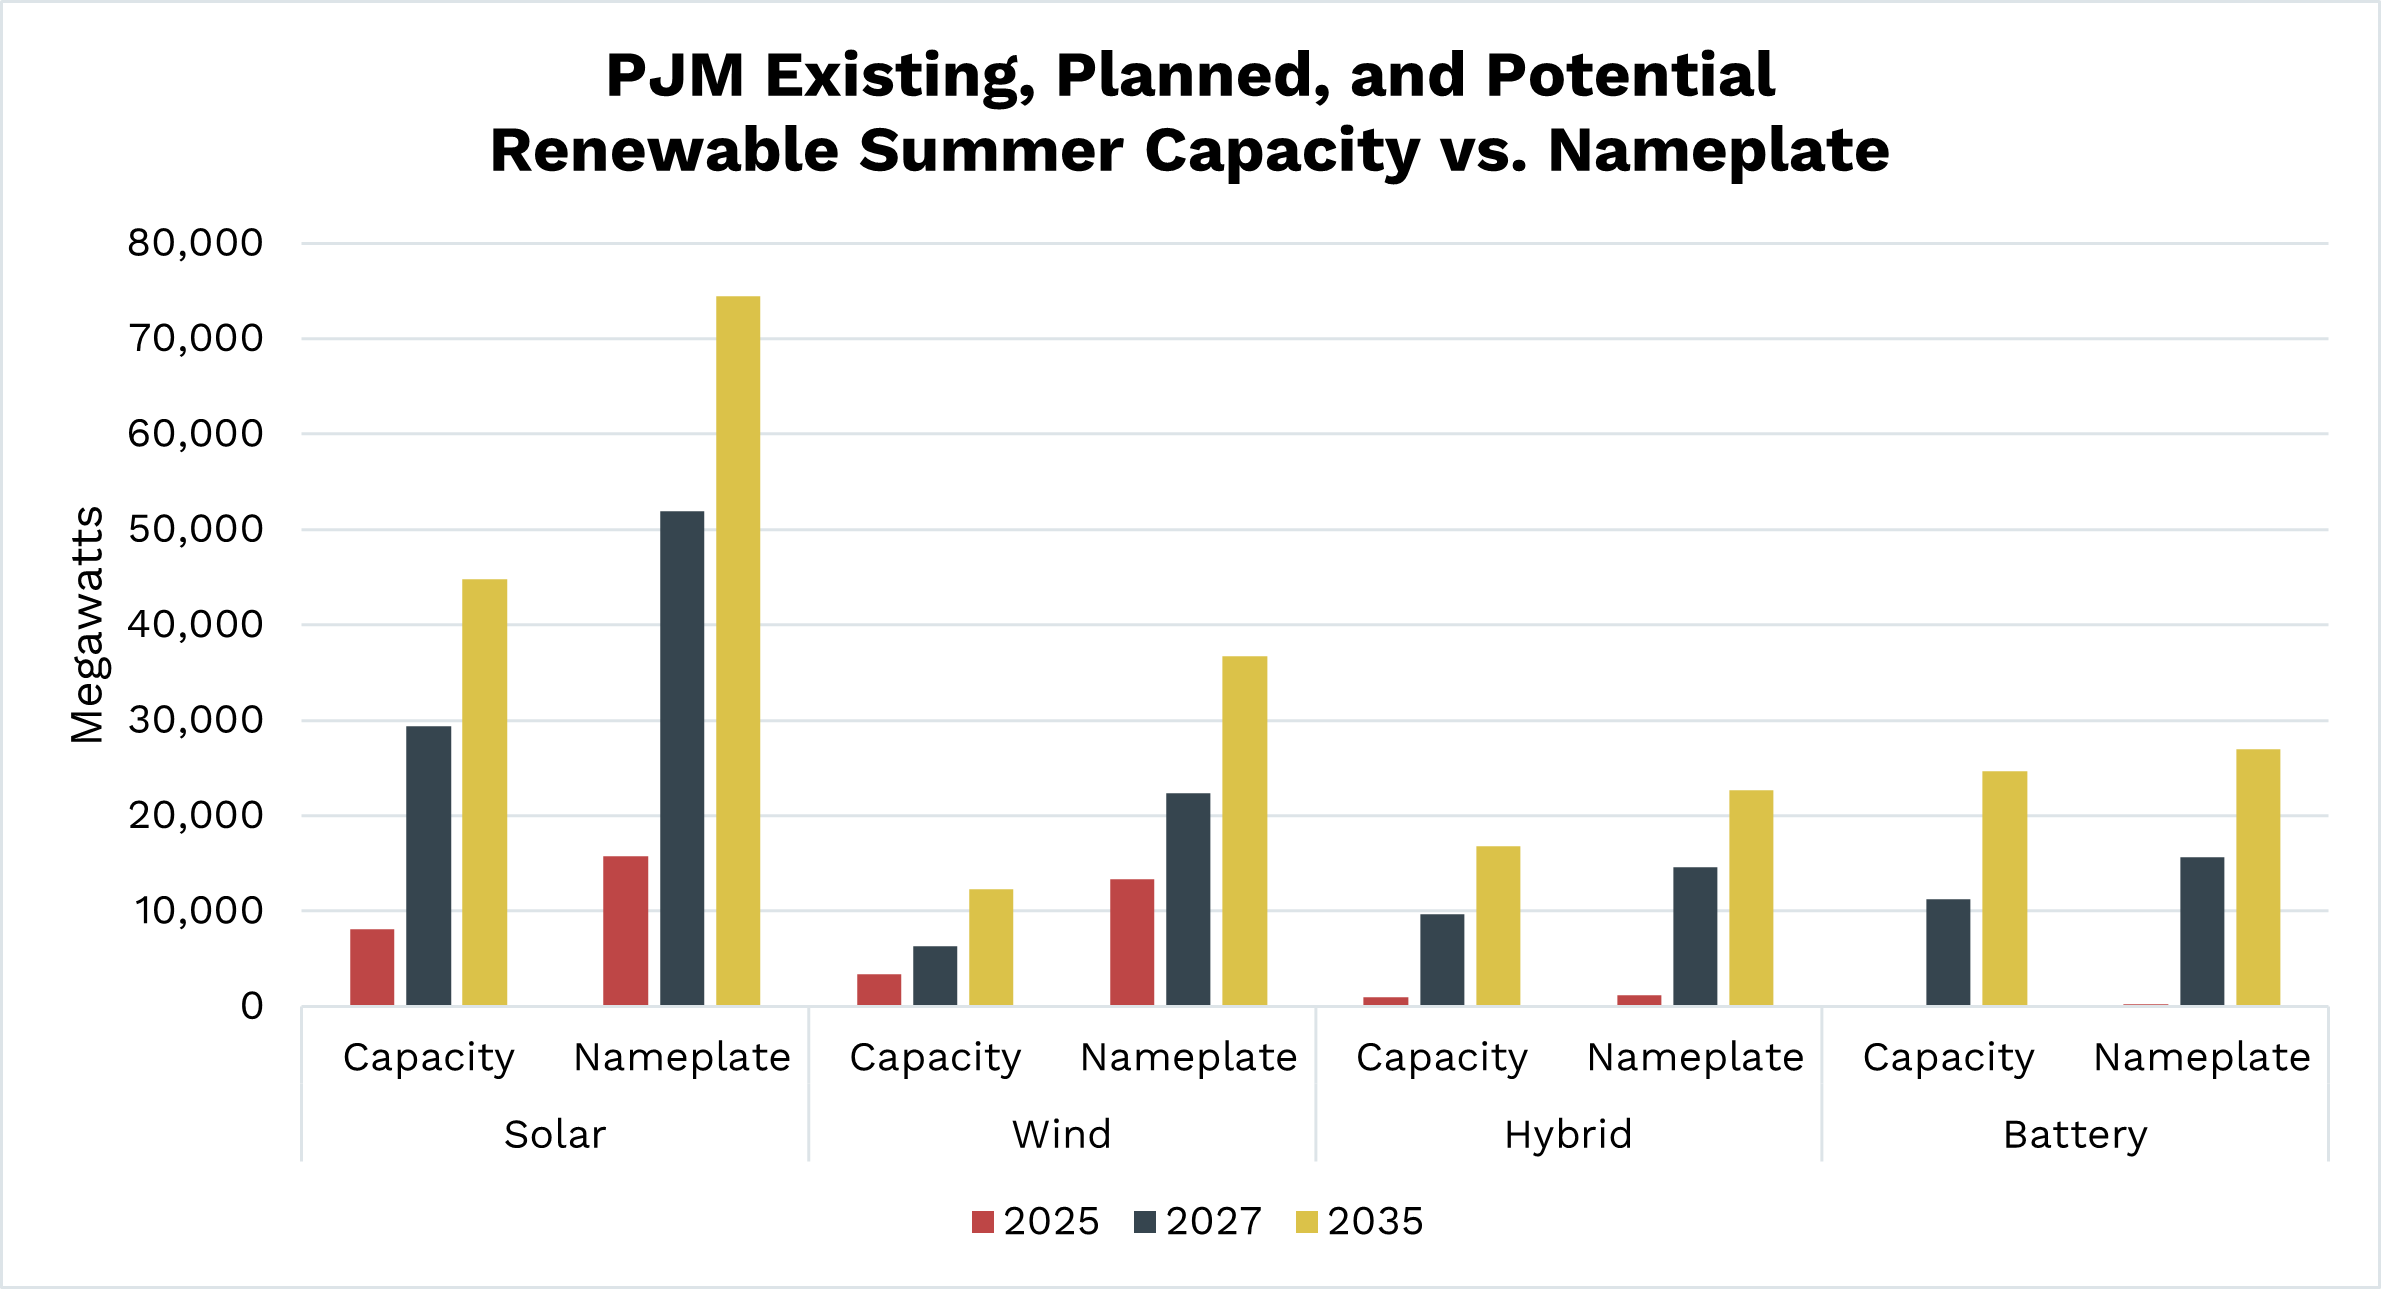
Figure 21
Figure 21
For summer of 2035, PJM has substantial nameplate capacity available for solar and wind – 111 GW combined, with an available capacity of only 57 GW. This results in solar and wind on average having a 58% and 30% capacity value, respectively, over the next 10 years. PJM has a higher capacity value for wind due to a portion of their wind resources being offshore along the Atlantic coast.

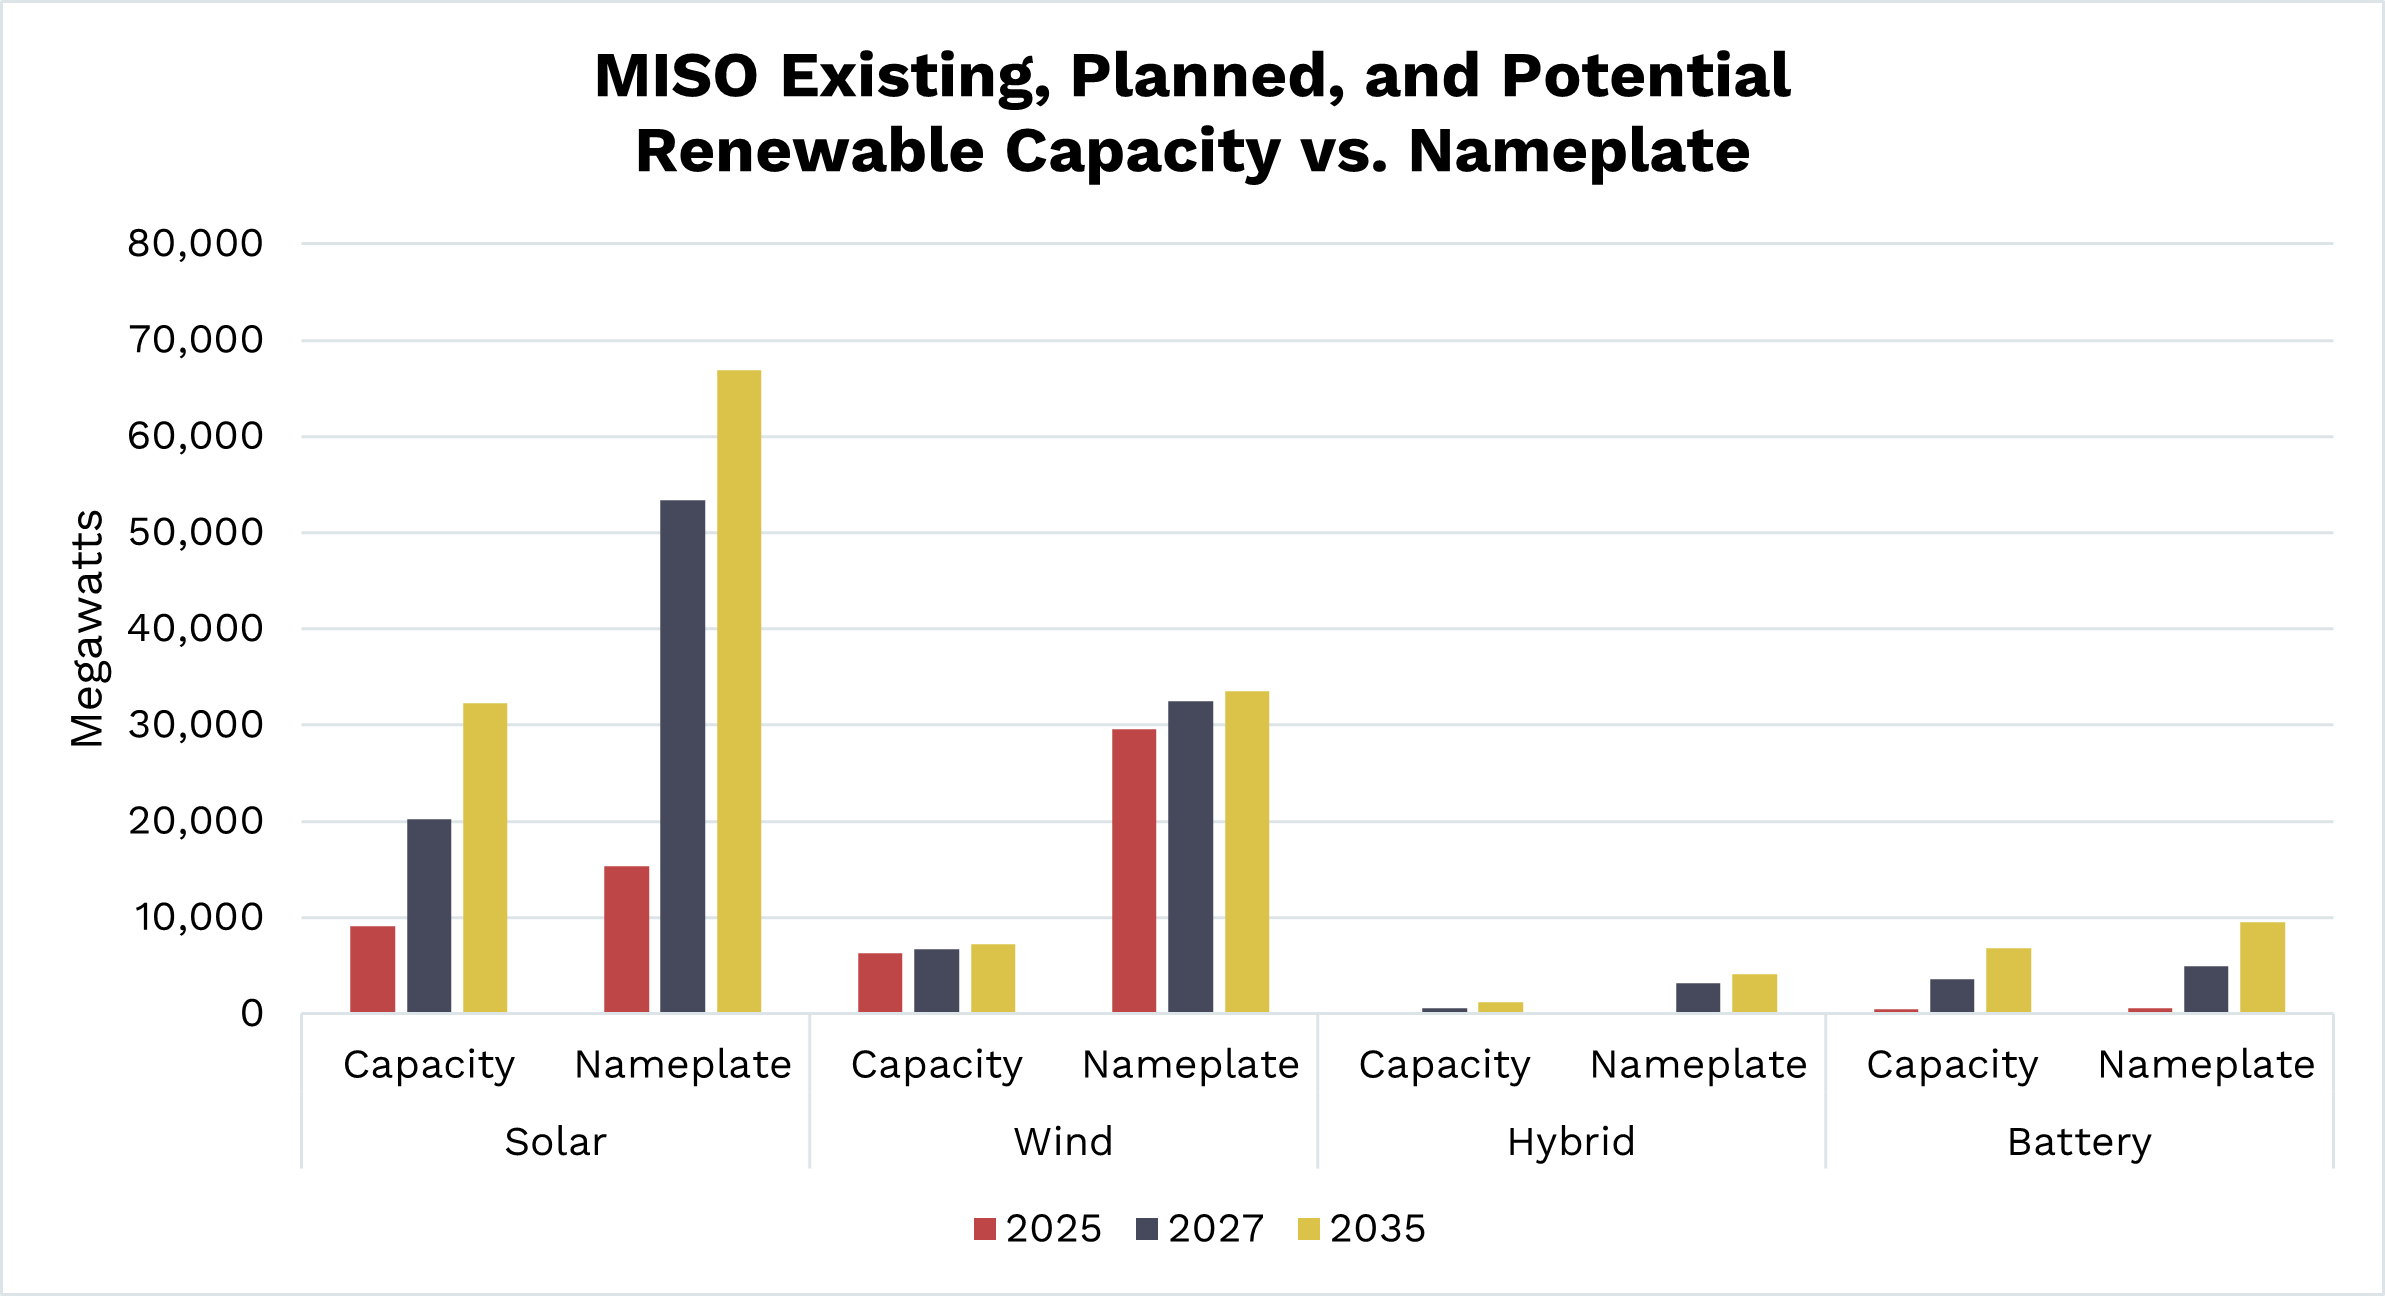
Figure 22
Figure 22
For summer of 2035, MISO also has substantial nameplate capacity available for solar and wind – 100 GW combined, with an availability capacity of 40 GW. This results in solar and wind on average having a 47% and 21% capacity value, respectively, over the next 10 years.
Key takeaways
Both PJM and MISO are anticipated to have natural gas remain as the dominant resource over the next 10 years.
In addition, both PJM and MISO expect retirements in coal, natural gas, and petroleum, but MISO will see more generation retire than PJM.
Solar generation, which has different availability characteristics compared to the resources being retired, is likely to experience significant growth in the future. As the grid integrates more renewables, just-in-time gas, and short-term storage, risks from rare but severe events rise, even with sufficient capacity reserve margins.


Additional considerations


Energy policy changes
State and federal energy policies have resulted in significant changes to the bulk power system (BPS), and these policies have rapidly shifted in recent years. While some policy changes support grid reliability needs, misalignment between state and federal policies combined with rapid changes in direction can make it more difficult to take timely action to address resource adequacy challenges. These challenges are compounded by permitting constraints and lengthy infrastructure development and construction timelines. For these reasons, the NERC 2025 ERO Reliability Risk Priorities Report identifies energy policy volatility as a primary risk to the electric grid.
Recent executive orders and legislative actions have prioritized conventional energy sources such as coal and natural gas. Notably, the White House’s declaration of an ‘energy emergency’ enabled the issuance of three different emergency orders under Federal Power Act (FPA) section 202(c) to keep specific power plants within the RF footprint operating past their planned retirement dates or beyond environmental run-hour limitations. Conversely, recent legislation and subsequent related actions have repealed funding for intermittent and low-carbon resources, and offshore wind initiatives have faced reduced federal support and increased oversight. Many of these changes reflect evolving policy priorities, including a shift in focus away from some renewable energy initiatives and increased support for the rapid expansion of data centers nationwide.
Many states are focusing on building out nuclear energy to meet energy needs, which often receives bipartisan support at the state and federal level. For example, the Palisades Nuclear Generating Station in Michigan is slated to be the first reopened nuclear facility in the U.S.; Wisconsin is advancing legislation for a second nuclear plant; and Maryland and Delaware have introduced bills supporting nuclear development.
Transmission planning and supply chain disruptions
As discussed within this assessment, the generation portfolios within both PJM and MISO are undergoing a major transformation. Increased reliance on solar generation will necessitate additional resources or increased transfer capability during dawn and dusk when solar becomes unavailable. In addition, extreme weather that impacts resource availability over a wide area may be alleviated with transmission solutions. To analyze these types of conditions, Congress mandated the Interregional Transfer Capability Study (ITCS) in the Fiscal Responsibility Act of 2023.
The ITCS was conducted in collaboration with NERC and the Regional Entities (which include ReliabilityFirst), and the ITCS report includes recommendations for “prudent additions” to address identified resource shortfalls. The need for prudent additions was identified in both the PJM and MISO footprints. The ITCS report recommends prudent additions that increase transfer capability between neighboring areas, involve the construction of local generation, or increase demand response resources. For transmission solutions, multiple options were provided for consideration and include upgraded transmission infrastructure, implementation of Remedial Action Schemes (RAS), dynamic line ratings (DLR), and power-flow control devices.
The ITCS report acknowledges the need for additional study work to identify the proper solutions to the identified need for prudent additions. It notes that subsequent studies performed by both PJM and MISO should be coordinated to identify the most effective solutions across wide areas. While increased transfer capability is a viable option to address resource shortfalls, the construction of new transmission lines can be a long process that is subject to lengthy siting processes, property acquisition difficulties, restricted outage windows, labor unavailability, and supply chain delays.
Environmental factors
Environmental factors impacting resource adequacy in the RF region include naturally occurring phenomena such as extreme weather and vegetation related issues. The geographic location of the RF footprint makes it susceptible to a wide variety of environmental factors, as the region experiences cold weather and winter storms and contains lush green landscapes, making vegetation management near transmission lines vital to grid reliability.
Weather in the RF footprint poses a risk to the availability of generation resources, and also impacts the availability of transmission lines and transformers. The risk continues to increase as cold weather events cause generation outages, such as Winter Storm Elliott in 2022, which saw both PJM and MISO experience a large amount of generation outages, derates, or failures to start. To support winter preparedness and enhance resilience, RF offers voluntary winter assessments that help generators across the region proactively plan for and withstand extreme cold weather events.
Although RF has the lowest outage frequency across North America, weather is one of the top causes of those outages. Lightning, weather, and vegetation accounted for 29% of transmission outages within the RF footprint over the last four years, which is higher than the 25% of outages caused by human performance issues. RF is continuing to monitor these outages, including a slight uptick in duration despite a multi-year downward trend. RF also offers a Vegetation Management Community of Practice to help mitigate risk, and plans to obtain more detailed data around equipment failure related audits and explore additional sources of weather data.
Resource development delays
Delays in bringing new resources online, both generation and transmission, pose a growing risk to resource adequacy. These delays are driven by a complex mix of siting and permitting challenges, supply chain constraints, economic conditions, policy volatility, jurisdictional overlap, and local opposition. Collectively, these factors slow the deployment of critical infrastructure needed to support a changing generation mix and accelerating demand growth. Assigning clear ownership to these risks is essential, to ensure that mitigation strategies are not only identified but actively pursued through outreach, education, and policy engagement.
These delays are not unique to the ReliabilityFirst footprint - they are prevalent nationwide. Turbine manufacturers report delivery timelines extending into 2028–2030, and utilities are facing transformer lead times of up to two years. These backlogs compound project costs and create timing mismatches between retiring generation and replacement capacity. This dynamic is especially critical as load growth surges due to data center and manufacturing expansion, and electrification. ReliabilityFirst emphasizes the urgency of coordinated action to align infrastructure development with reliability needs, recognizing that the pace of change must be managed to avoid compromising grid stability.
Imports and exports
Balancing generation and load on a state-by-state basis is challenging due to the interconnected nature of the grid. Electricity naturally flows across state lines based on demand centers, transmission constraints, and economic dispatch. As a result, states that rely heavily on imported power should carefully evaluate their risk exposure, particularly as neighboring states may be experiencing load growth or generation retirements that could affect their ability to export power.
With growing concerns around resource adequacy, states and RTOs are engaging in strategic discussions about shaping future resource mixes and aligning market design, policy, and transmission planning to support reliability. Long-term transmission planning, grid enhancing technologies, and flexible load management are key tools to help mitigate these risks. NERC’s ITCS report reinforces the importance of expanding transfer capacity to ensure reliable access to distant resources, especially during extreme conditions.
Additional resources
Newsletters
Want to stay up to date on key updates and reports from RF? Get our monthly newsletters in your inbox.